Complete User Guide
A trading textbook built around a single tool
From first install to systematic trading — step by step, with examples, no fluff.
A Complete Trading Strategy — Ready to Use
Open on TradingView →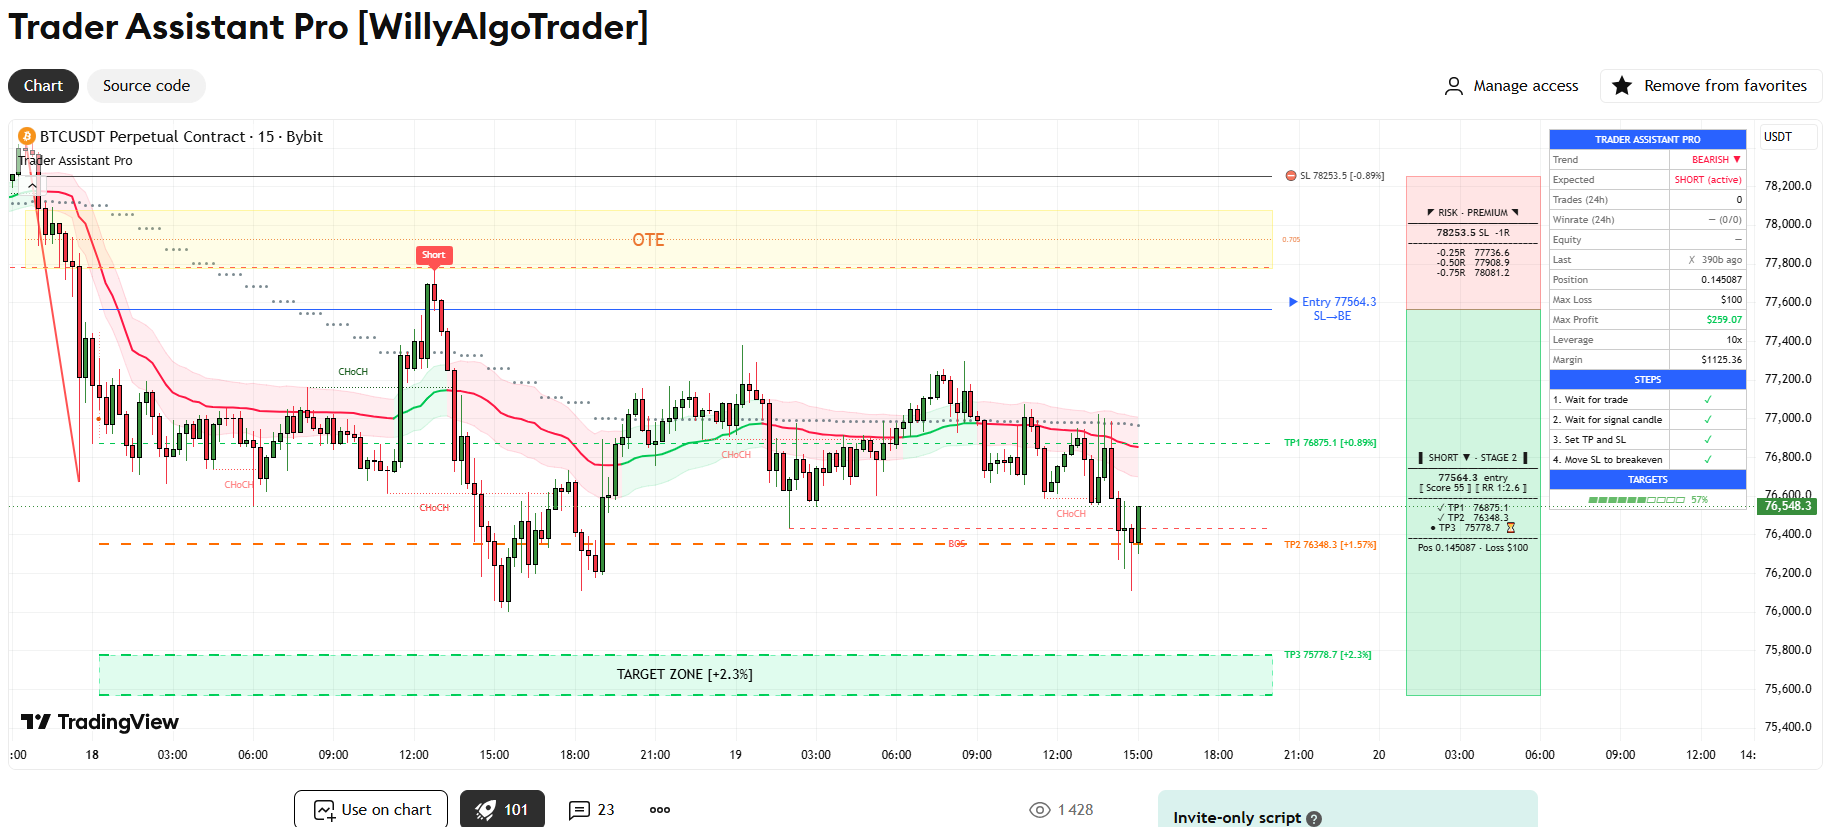
Trader Assistant Pro is a tool. A very good one — well thought out, saves you hours of routine work. But it's not a magic button that prints money while you sleep. If you came here looking for a "guaranteed profit" — close this document and don't waste your time. No such product exists from any author in the world, and anyone who promises otherwise is either mistaken or lying.
What the indicator actually does: filters out questionable setups, enforces discipline, calculates risk, shows market structure, and walks you through every trade step by step. What it doesn't do: make decisions for you, predict news shocks, override the law of large numbers, or force the market to move in your favor.
The tool makes discipline possible. It won't let you enter without confirmation, won't let you risk more than your limit, won't let you forget your stop. But you're the one clicking the buttons on the exchange. And if you decide "this time I'll set a wider stop" — the indicator can't stop you.
This guide is based on a simple idea: systematic trading isn't about guessing direction — it's about executing a proven algorithm many times in a row. The indicator gives you the algorithm. Your job is to learn to execute it.
All materials in this guide are provided for educational purposes only and do not constitute individual investment advice. Trading on financial markets carries a high level of risk and may result in the complete loss of invested funds. The author of the indicator and the author of this guide are not responsible for your trading decisions or their financial outcomes. Past performance does not guarantee future results.
If you've read this and agree — turn the page. If not — please don't buy this or any other indicator. Seriously.
What's New in Version 2.0
This edition of the guide matches the current build of Trader Assistant Pro. If you read version 1.0, here is what has been added to the indicator — and where in this guide each feature is covered:
- Instrument Presets — 13 ready-made configurations from a year-long full-grid backtest (BTC, ETH, SOL, HYPE, gold, silver, Brent, NIFTY, BANKNIFTY, SPY, QQQ, NVDA, TSLA). One dropdown instead of manual tuning → 6.8.
- Confluence Gate — a hard quality filter that blocks the trades themselves, not just alerts → 6.9.
- Presets Backtest Table — a static on-chart reference with the yearly results of every preset → 9.12.
- Profit Factor in the dashboard (replaces the Equity sparkline) and a non-destructive stats period filter → 9.3.
- Risk Section — an optional full risk panel: live P&L, exit scenarios in money, daily loss limit, losing streak, expectancy, STOP TRADING banner → 9.10, plus a MARKET block → 9.11.
- Rebuilt alert system — five engine events (trade_armed / trade_opened / sl_moved / sl_hit / tp_hit) named after the STEPS checklist, eighteen named conditions, unified filters and custom alert texts for bots → chapter 8 (fully rewritten).
- FVG noise filters — Min FVG Size (× ATR) and Max FVG Age, plus V-marks on inverted gaps → 11.1.
- Auto Fibonacci LL↔HH with optional extension targets, and a Range Volume Profile with POC and stop-volume zones → 11.6, 11.9.
- Pullback PRO — an optional stricter reversal engine (body/wick/volume filters) that can also harden trade confirmation → 11.10.
- Adaptive Thresholds — volatility-regime scaling of key filters via an ATR-percentile sensor → 11.11.
- Live re-anchoring — before entry, point 2 now trails the true extreme and the whole plan moves with it; documented in detail → 11.12.
- Quality-of-life switches — Keep Entry Labels on History, force-close of stale trades, raw Swing Reversal visuals → 11.13, 6.1.
Everything else — the 1-2-3 logic, the trade cycle, risk management, the strategies — works as described before, with accuracy fixes applied throughout the text.
Chapter 1. Introduction: Why You Need This Indicator
1.1. What Trader Assistant Pro is, in plain language
Imagine an experienced trader standing behind you. He's looking at the same chart you are. When a good trading situation forms, he points at the screen: "here's your entry, here's your stop, and here are three targets the price will most likely reach." He also calculates the position size for you so you don't risk too much. And he keeps your stats so you can see your progress.
Trader Assistant Pro does roughly the same thing — except it's code, not a person. It analyzes price structure, catches the classic "1-2-3" chart formation, scores its quality by several criteria, draws all the necessary levels on the chart, calculates risk for your deposit, and walks you through every trade from setup to close.
The main difference from typical indicators: you don't have to fill in the blanks. Most indicators show a signal and leave you alone with questions like "where do I put the stop? how far do I hold? how much should I invest?" Trader Assistant Pro answers all three automatically — and that's what turns random signal-trading into systematic work.
1.2. What problem this tool actually solves
Let's be honest: why do most beginner traders lose money? Not because they're stupid or lazy. It's because in trading, discipline matters more than intelligence — and discipline is very hard for humans to maintain. Here are the typical traps almost every beginner falls into:
- "I'll enter without a stop, the market will reverse." It won't. You'll lose half your account.
- "This is a strong move, I'll risk more." That exact trade will be the losing one, and you'll lose a month's earnings.
- "Let me close in small profit, just so I'm not red." Price will then run another 5R without you.
- "I'll move the stop, give it some room." The stop hits anyway, but now the loss is twice as big.
- "I'll just enter on a feeling, figure it out later." Feelings don't work. Statistics do.
Each of these mistakes is a discipline failure. And Trader Assistant Pro fights each of them head-on:
- The stop is already drawn on the chart before you enter. Not setting it would be a conscious choice, not "I forgot."
- Position size is calculated automatically from your chosen risk percentage. You physically see the dashboard show how much you'll lose if the stop hits.
- Three take-profit levels are shown on the chart in advance. You know where you'll close partial positions before you even enter.
- Moving the stop to breakeven is prompted by the indicator itself — a "SL→BE" marker appears. Moving the stop against yourself becomes psychologically very hard.
- To enter, you need two independent confirmations: structure formation (a 1-2-3 pattern with sufficient quality) and a signal candle inside the entry zone. Impulsive "gut feeling" entries are cut off at the source.
The indicator doesn't make you a better analyst. It makes most classic beginner mistakes impossible. And that, surprisingly, is enough for the statistics to start working in your favor.
1.3. What this indicator does NOT do (important to understand upfront)
To avoid disappointment, let's lay out what's beyond the tool's capabilities right away:
It doesn't trade for you automatically
Trader Assistant Pro is an indicator, not a trading bot. It shows levels, draws the markup, and sends alerts. You still have to open orders on the exchange with your own hands. This is intentional: no fully automated system survives in a real market without human supervision.
It doesn't predict the future
If the indicator shows a setup with Score 85 — that doesn't mean price will definitely reach the target. It means the formation is very high-quality by mathematical criteria, and in a large sample of such trades the statistical expectation is positive. But any specific trade can go either way. Accepting this is a non-negotiable condition for psychological stability.
It doesn't work the same in all conditions
The 1-2-3 pattern is a trending formation. In a strong trend it works brilliantly. In a sluggish range, it gives many false signals. During news spikes you shouldn't trade at all. The indicator doesn't tell a "calm market" from a "crazy" one — that's your job.
It doesn't replace a trading journal
Even the built-in dashboard with winrate and profit factor won't replace a proper journal where you record your thoughts, emotions, and mistakes. The dashboard shows what happened. The journal answers why. Without the second, there's no growth.
Winrate for systematic 1-2-3 trading on the right timeframes can vary widely: from around 45% (on aggressive strategies with many trades) to 75-78% (on strictly filtered conservative setups). If you're expecting a 90%+ winrate, you'll be disappointed — no indicator delivers that.
Series of 4-5 losing trades in a row are statistically normal and inevitable, even on a good system. It's not "the indicator broke," it's just math. But that doesn't mean you should trade through them without a break — Chapter 7 covers the rules for pauses after losses. The streak is normal for statistics; the pause is necessary for your psyche.
1.4. Which markets and timeframes the indicator works on
Trader Assistant Pro is universal in the sense that the 1-2-3 pattern and structural analysis work on any liquid market. That doesn't mean the result will be identical everywhere.
Recommended markets
- Crypto (BTC, ETH, major alts): 24/7 market, high liquidity, clean trending moves — ideal environment.
- Forex (majors EUR/USD, GBP/USD, USD/JPY): works great during the London and New York sessions.
- Indices and futures (S&P 500, Nasdaq, oil, gold): good during main session hours.
- Liquid stocks (mega-caps — Apple, Tesla, Microsoft, etc.): they work, but avoid earnings days.
Where it works poorly or not at all
- Low-liquidity altcoins (especially memecoins) — too much noise and manipulation.
- Thinly traded stocks — no statistically significant moves.
- Highly volatile periods (FOMC, earnings, force-majeure news) — structure breaks in a single candle.
Recommended timeframes
| Trading style | Working TF | Higher TF (HTF) | Average trades |
|---|---|---|---|
| Scalping | 5 min | 30-60 min | 5-15 per day |
| Intraday | 15 min | 1-2 hours | 2-5 per day |
| Swing (recommended for beginners) | 1 hour | 4 hours – daily | 3-8 per week |
| Positional | 4 hours | Daily – weekly | 2-5 per month |
If you're just starting — forget 5 and 15 minute charts. Seriously. Lower timeframes show more formations, but the noise and false signals scale even faster. You have to make decisions in seconds, and you don't have that skill yet.
Start with the hourly chart. Setups appear every few days, you have time to analyze calmly, place orders, and go grab a coffee. After 2-3 months, when you've developed a feel for the system, you can drop lower.
1.5. What you'll get from reading this guide
By the end of this guide you'll be able to:
- Install and configure the indicator for your trading style.
- Read the chart like a map: understand every element, every line, every mark.
- Recognize high-quality setups and filter out weak ones.
- Open trades following a strict step-by-step algorithm.
- Manage open positions: move stops, close partially, use trailing.
- Calculate risk so a losing streak doesn't destroy your account.
- Set up alerts and trade without sitting at the screen 24/7.
- Use the built-in dashboard to track your progress.
- Avoid the typical mistakes that burn most beginners.
This isn't a marketing promise. It's just what happens if you apply all the instructions in this document. If you don't apply them — nothing will change. Knowledge without action doesn't work.
1.6. How to read this guide (a roadmap)
The document is long — about 80 pages. That doesn't mean you should read it all in one sitting. Here are three reading routes depending on your experience level:
Route "Complete beginner" (never traded before)
Read linearly: chapters 1 → 2 → 3 → 4 → 5 → 7 → 10 → 12. That gives you the complete base without overload. Chapters 6, 8, 9, 11 — save for later, once you've made your first 10-20 trades and have specific questions.
Route "I already trade, but I'm new to this indicator"
You can skip the theory (Chapter 4) and the basic risk management principles (Chapter 7) — there's nothing new for you there. Focus on chapters 2 (setup) → 3 (anatomy) → 5 (trade cycle) → 9 (dashboard) → 6 (strategies). The rest — as needed.
Route "Experienced trader, want to squeeze max out of the indicator"
Skim chapters 1-7, focus on chapters 6 (strategies and presets), 11 (advanced features), 12 (FAQ). Chapter 10 (mistakes) is useful as a reminder — even experienced traders stumble on them.
Don't try to memorize everything on the first pass. Come back to the guide as you trade — chapters 3, 5, 7, 10 you'll probably re-read many times. That's normal. The document is built as a reference, not a novel.
Ready? Let's go.
Chapter 2. First Setup in 5 Minutes
In this chapter we'll go from a blank chart to a fully working setup. No extra details — just the bare minimum to start seeing setups. We'll do the fine-tuning later, once you understand what each parameter does.
2.1. Step 1. Add the indicator to your chart
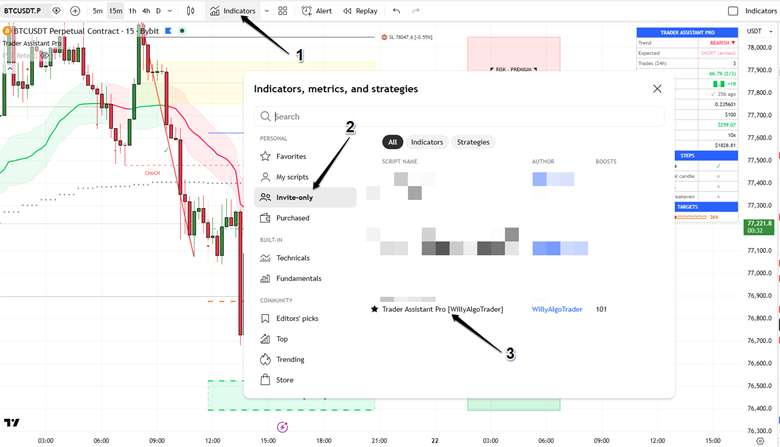
- Open TradingView and any chart (for your first run I recommend BTCUSDT on Binance, 1-hour timeframe).
- In the top menu click "Indicators" (the fx chart icon).
- In the search box type "Trader Assistant Pro" and pick the indicator from the list (it should have a lock icon if you have access).
- The indicator will automatically appear on your chart. Don't panic if you see lots of lines and labels at once — we're about to enable and disable what we need.
2.2. Step 2. Open the indicator settings
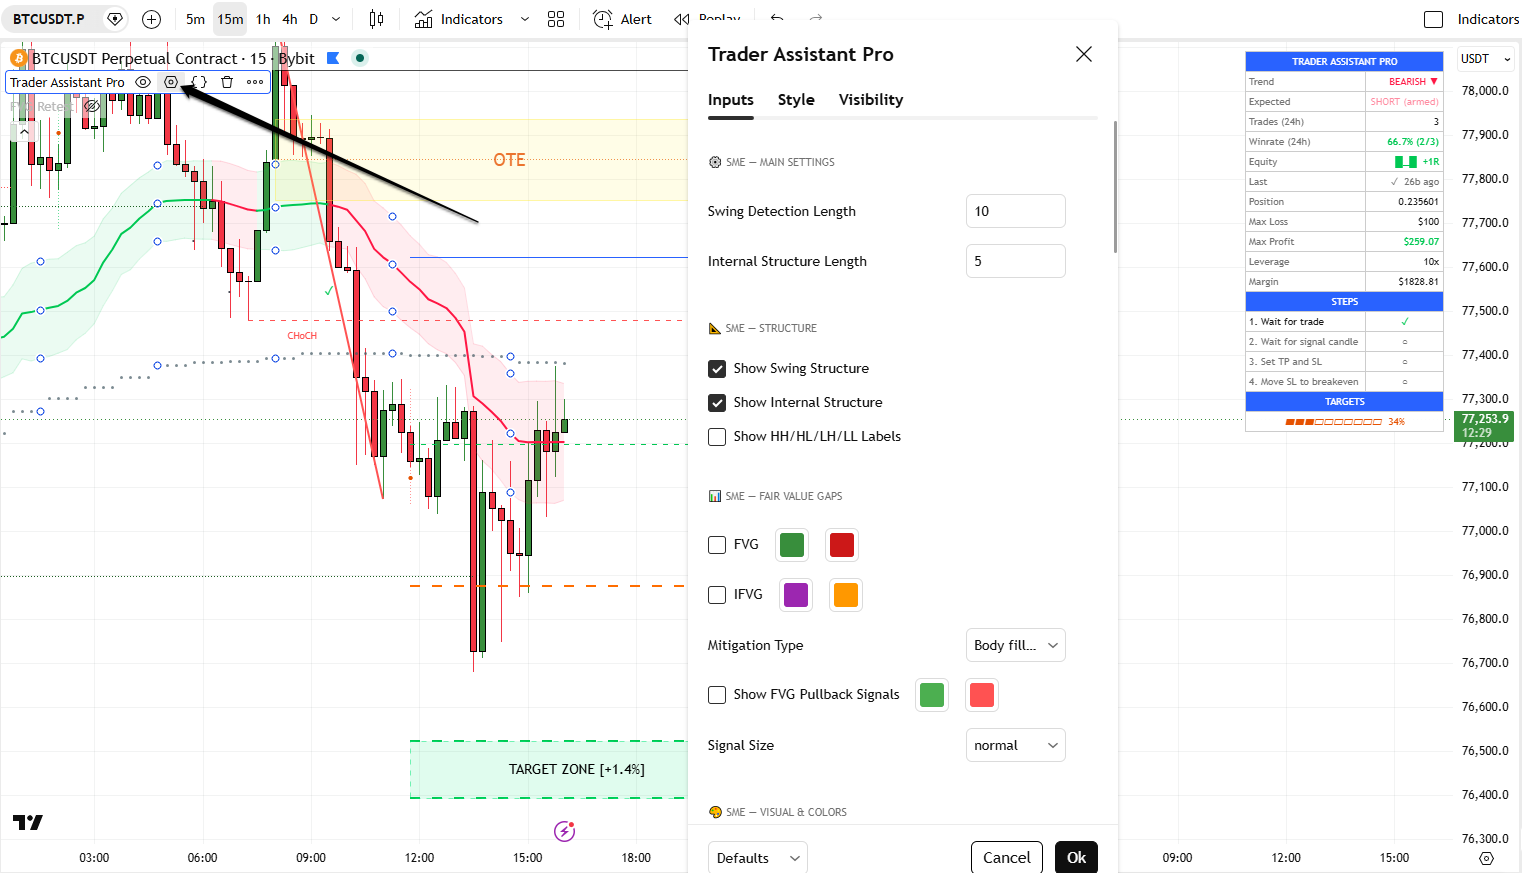
Once the indicator is on the chart, you can open its settings two ways:
- Double-click any line or label of the indicator directly on the chart.
- Hover over the indicator name (top-left of the chart) and click the gear icon.
A window with several tabs will open. We need the "Inputs" tab. If it's not active — switch to it.
2.3. Step 3. Set up the Risk Manager — do this first
Open the group "💰 123 — Risk Manager". The most important parameters in the entire indicator live here. You absolutely cannot trade without configuring this block correctly — the indicator will draw setups, but won't be able to calculate your position properly.
Required parameters:
| Parameter | What to set | What it means |
|---|---|---|
| Account Balance | Actual size of your deposit | For example, 1000. Used to calculate position size and warn about balance overruns. |
| Sizing Mode | Risk-based | Allocation = the amount you're willing to risk on one trade. Safest mode for beginners. |
| Allocation Mode | % of Balance | Calculate risk as a percentage of deposit. |
| Allocation % | 1.0 | One percent. This is the gold standard. Nothing more. |
| Leverage | Actual leverage you use on the exchange (usually 5-20) | Affects only the calculation of required margin in the dashboard. |
| Currency Symbol | $ or € — whichever suits you | Cosmetic, shown in the dashboard. |
At 1% risk per trade, even a streak of 10 losing trades in a row (very rare) leads to a drawdown of about 10% — painful but not fatal. The account recovers with a few good trades.
At 5% risk, the same streak eats half the deposit, and recovering requires doubling what's left — that means 100% return. Psychologically, that's lethal.
At 10% risk, full account wipeout comes after 9-10 losses in a row. And it will come — sooner or later, for everyone. It's not a question of "if," it's "when."
The difference between Risk-based and Margin-based — why it's critical
The indicator has two position-sizing models, and they work fundamentally differently. Mixing them up means blowing your account on the very first trade.
| Parameter | Risk-based (recommended) | Margin-based |
|---|---|---|
| What "Allocation" means | Maximum you'll lose when the stop hits | Margin (collateral) you allocate to the trade |
| Position size | Calculated from distance to stop | Calculated from margin and leverage |
| What happens with a wide stop | Position size shrinks — loss is still = 1% of deposit | Position size stays the same — loss can be 5-10x bigger |
| Who it suits | Everyone, especially beginners | Only those who trade fixed margin size and control risk themselves |
Until you can explain to another person the difference between Risk-based and Margin-based and why the first is safer — use Risk-based only. This single setting has saved more accounts than any strategy in the world.
2.4. Step 4. Enable the trend filter
By default, the indicator trades both longs and shorts regardless of trend. That gives you more setups, but more false ones too. As a beginner, it's better to trade strictly with the trend — that sharply increases winrate.
Open the group "⚙️ 123 — Main Settings" and set:
- Trend Filter: Trend Bands
What this does: the indicator will only draw setups whose direction matches the global trend. For example, if the overall trend is bullish — only longs will appear, shorts will be ignored even if the formation looks perfect.
Countertrend trades are possible in principle, but they require strong experience reading structure. A beginner trading against the trend usually gets steamrolled. The trend filter removes that possibility for error. Once you've done 200+ trades — you can experiment.
2.5. Step 5. Enable Trend Bands and HTF Trend
Open the group "📈 Trend Bands":
- Show Trend Bands — checkbox should be on.
- Show HTF Trend — checkbox should be on.
- HTF Timeframe: set the higher timeframe relative to your working one.
Simple rule for choosing HTF: the higher timeframe should be about 4-6 times bigger than your working one.
| Your working TF | Recommended HTF Timeframe | What to enter in the field |
|---|---|---|
| 5 min | 30 min | 30 |
| 15 min | 1 hour | 60 |
| 30 min | 2 hours | 120 |
| 1 hour | 4 hours | 240 |
| 4 hours | 1 day | D |
| 1 day | 1 week | W |
After applying the settings you'll see two new things on the chart:
- Colored bands (green in a bullish trend, red in a bearish one) — these are the Trend Bands of your working TF.
- A dotted gray line — this is HTF Trend, the higher timeframe trend. When price is above it, buyers dominate globally; below it, sellers do.
2.6. Step 6. Enable the dashboard
Open the group "📊 123 — Dashboard":
- Show Dashboard — must be checked.
- Position: "Top Right" (or another, if your top-right corner is already busy).
- Stats Period: "24h" to start. Later you can switch to 7d, 30d, or All to assess different horizons.
- Table Font Size: Small (the default is fine).
The dashboard is your onboard computer. It collects all key information in one place: current trend, expected direction, your statistics, position size, step-by-step checklist, and progress bar to targets. We'll cover it in detail in a separate chapter.
2.7. Step 7. Check the visual theme settings
If you use a dark TradingView theme, the indicator should auto-detect it and pick readable colors. If auto-detection didn't work (on some non-standard themes), set it manually:
- Group "🎨 SME — Visual & Colors" → parameter Theme → choose "Dark" or "Light" instead of "Auto".
2.8. Done! What you should see on screen
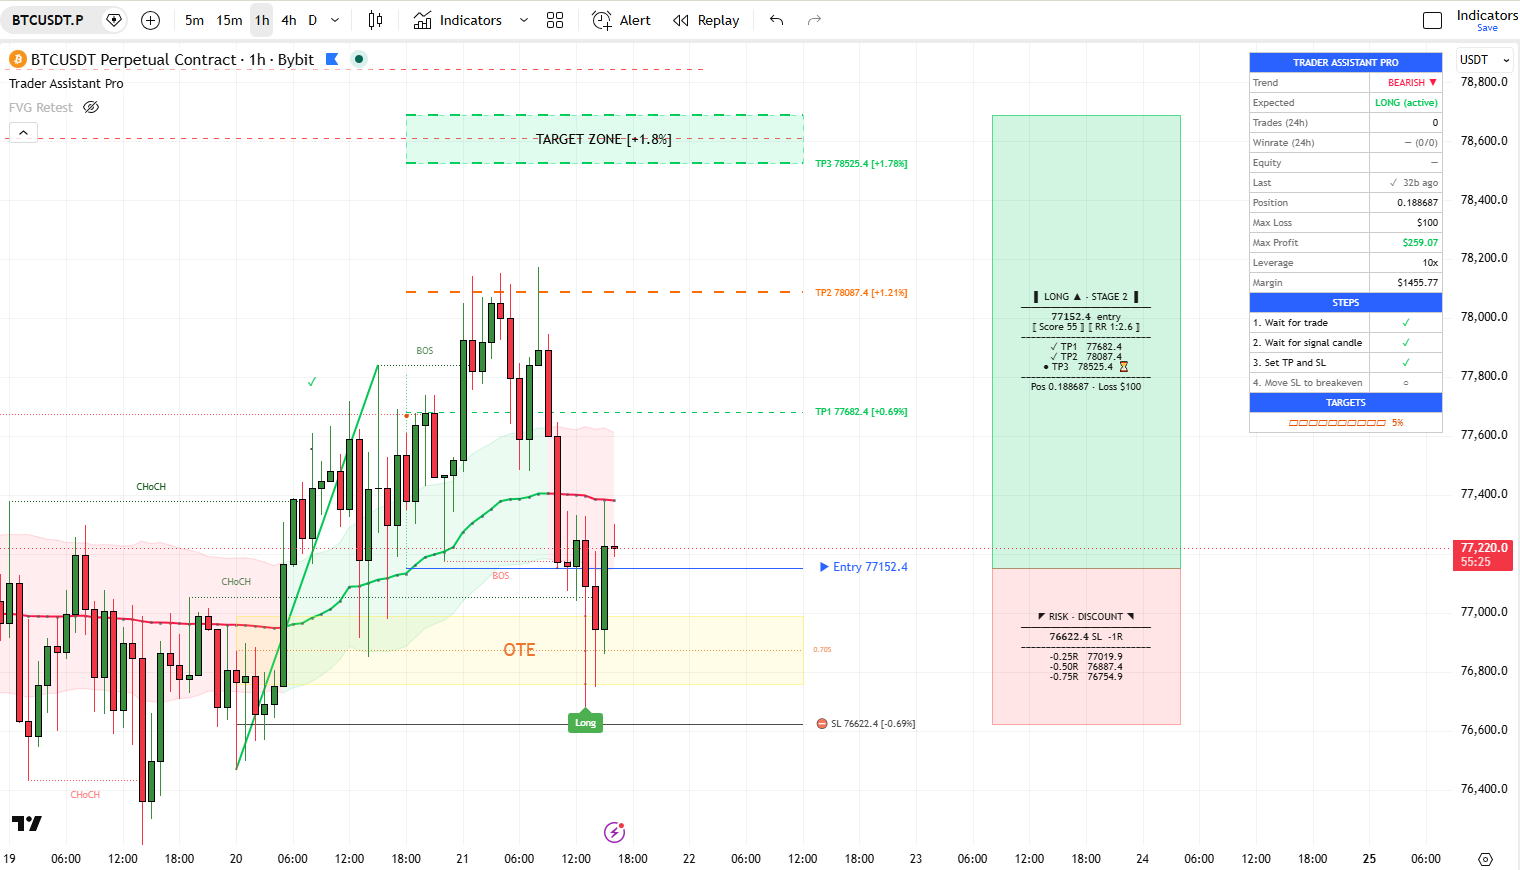
After all the settings, your chart should have:
- Colored trend bands around the candles.
- A dotted HTF Trend line.
- A dashboard in the top-right corner with live data.
- Possibly — a yellow OTE zone, blue Entry line, red SL line, green TP1/TP2/TP3 lines, if a setup is currently active.
1. Make sure the indicator is active on the chart (it should be in the indicator list at the top of the chart).
2. Check that the "Show ..." checkboxes are set as described in this chapter.
3. Scroll the chart back to let the indicator "warm up" — it needs a few dozen candles to start working.
4. If the issue remains — remove the indicator and add it again. TradingView sometimes glitches on first load.
2.9. What we did NOT configure and why
If you peeked into all the settings groups, you noticed we skipped many parameters. That's intentional. They all either have reasonable defaults or relate to advanced features we'll cover later. Specifically, we didn't touch:
- Fair Value Gaps (FVG / iFVG) — advanced Smart Money tool, covered in Chapter 11.
- Internal structure and HH/HL/LH/LL labels — these are "seasoning" for experienced traders; they only get in the way for beginners.
- Fine-tuning Pattern Score — covered in Chapter 6.
- Additional trailing levels (+1R, +2R) — covered in Chapter 5.
- Volume Profile inside the formation — also an optional feature, covered in Chapter 11.
Minimum working setup complete. Now let's break down what you're actually looking at on the chart.
2.10. The shortcut: pick an instrument preset
If you trade one of the 13 instruments the indicator was backtested on — BTCUSDT, ETHUSDT, SOLUSDT, HYPEUSDT, XAUUSD, XAGUSD, BRENT, NIFTY50, BANKNIFTY, SPY, QQQ, NVDA or TSLA — there is a faster path than tuning anything by hand. In the ⚙️ 123 — Main group, open the 🎯 Preset (instrument) dropdown and pick your symbol. The preset instantly loads the parameter set that won a year-long optimization for that instrument (details in 6.8).
Two things a preset does NOT do: it doesn't set up your Risk Manager (do step 3 of this chapter regardless — that's your money, not the market's), and it doesn't pick your timeframe (presets were optimized on 15m; see 6.8 for what that means on other TFs).
Chapter 3. Anatomy of the Screen: What You're Looking At
When the indicator runs at full power, there can be a dozen and a half different visual elements on the chart: lines, rectangles, labels, dots, text. Without knowing what each one means, the picture turns into mush. Let's break it down — you can use this section as a reference and come back to it later.
I'm not suggesting you memorize everything. Read it once for general understanding, then come back to sections as needed. After 2-3 weeks of practice you won't even glance at this anymore — your eye will adapt.
3.1. Map of the screen
Everything the indicator draws can be grouped into four categories:
| Group | What's in it | When it appears |
|---|---|---|
| Market background | Trend Bands, HTF Trend | Always |
| 1-2-3 formation | Point labels, lines between them, OTE zone | When a setup is detected |
| Trade plan | Entry, SL, TP1/2/3, Target Zone, info panels | When the setup is ready to trade |
| Confirmation | Long/Short pivot markers, colored touch dots | At entry moment and when levels are touched |
Let's go through each group in order.
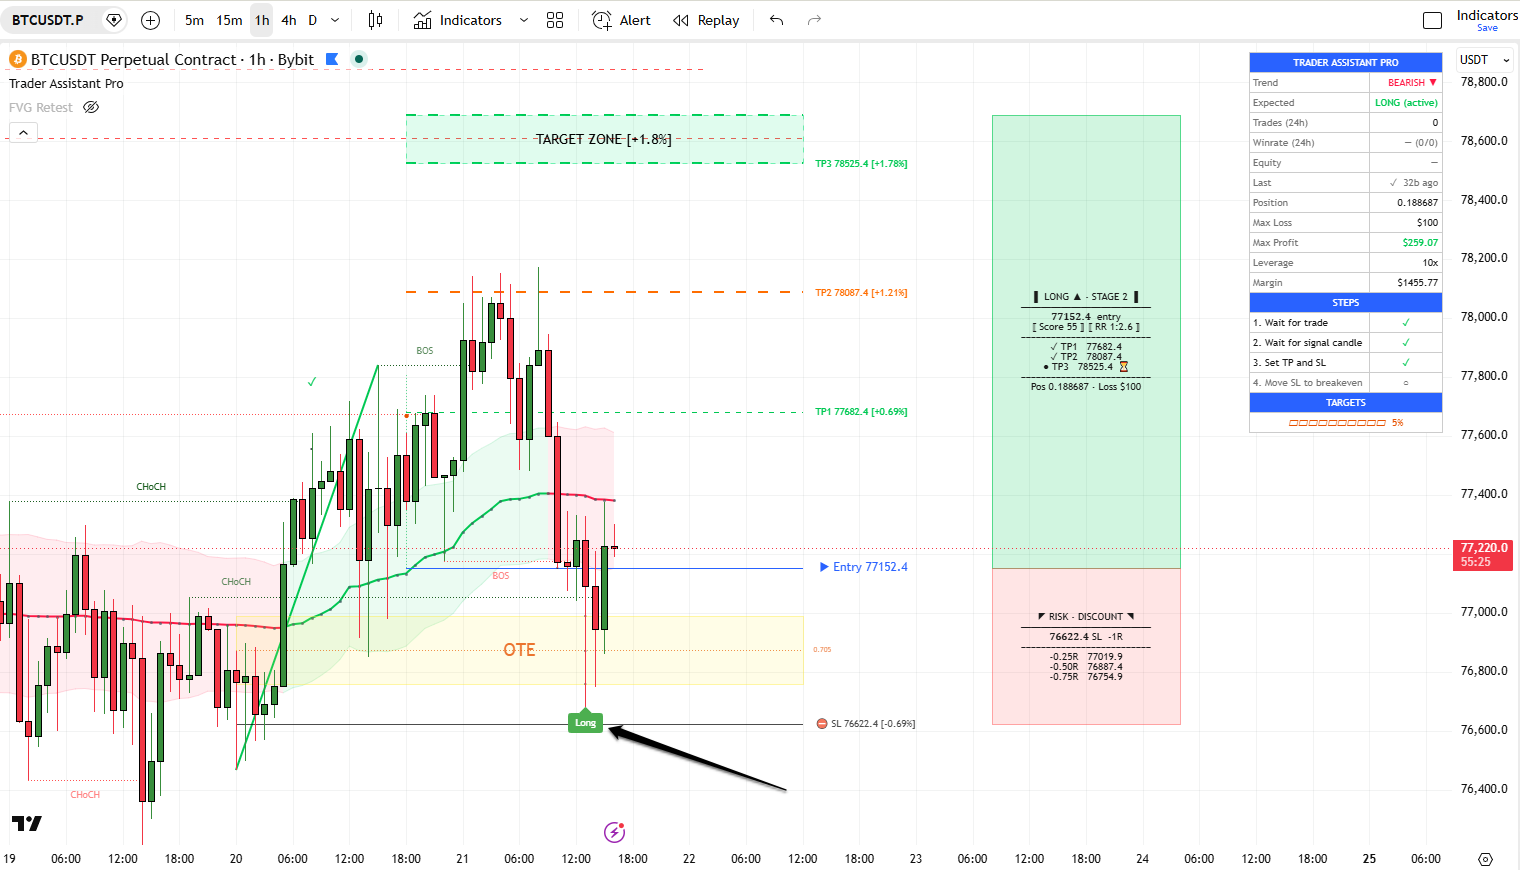
3.2. Market background: Trend Bands and HTF Trend
Trend Bands — current trend of the working TF
This is the main colored "ribbon" wrapping around the candles. It consists of three elements: a center line and two bands around it. The color of all three changes based on trend direction:
- Green (bullish trend): price has been closing above the upper band — market in uptrend.
- Red (bearish trend): price has been closing below the lower band — market in downtrend.
- Gray (neutral): no clear trend, market in range or transition phase.
If you set Trend Filter = "Trend Bands", the indicator will trade strictly by this color. Green bands → longs only. Red → shorts only.
When the bands widen — volatility is rising, the trend is gaining strength. When they narrow — the market is calming down, preparing to reverse or break out. Not a signal to act, but useful background context.
HTF Trend — higher timeframe trend
A dotted line, usually gray. This is a "simplified" trend of the timeframe you set as HTF Timeframe (for example, if you trade on 1H and set HTF = 4H, the line will show the 4-hour trend right on your hourly chart).
How to use it:
- Price above the line — global trend is bullish. Longs are the priority.
- Price below the line — global trend is bearish. Shorts are the priority.
- Price crosses the line upward — potential reversal to longs.
- Price crosses the line downward — potential reversal to shorts.
HTF Trend by itself is not an entry signal — it's context. It's there so you understand whose side "big money" is on, and don't open trades against the main flow.
3.3. The 1-2-3 formation — the indicator's main pattern
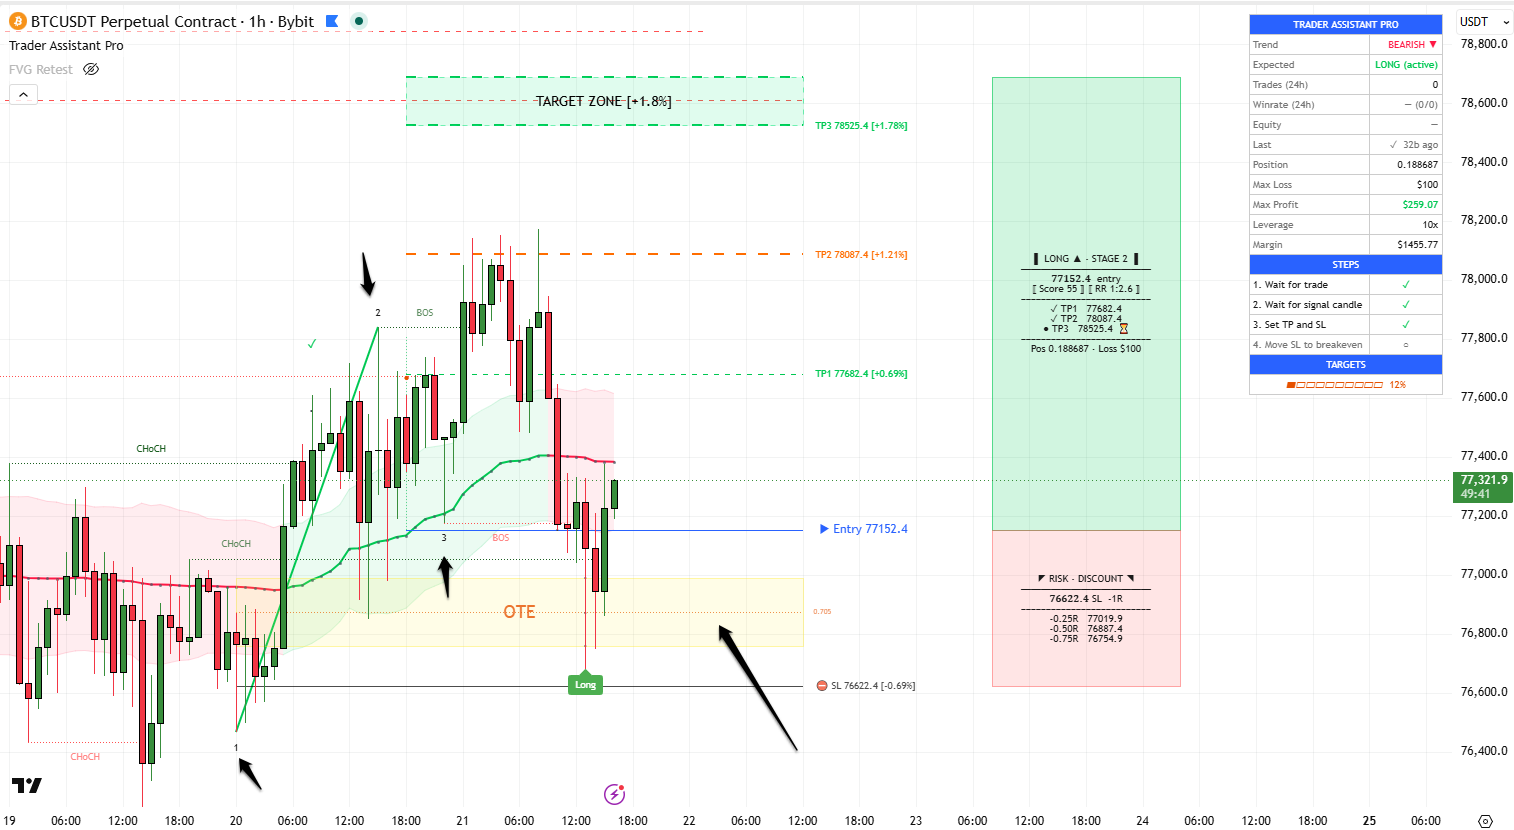
This is the heart of the whole system. When the indicator detects a forming 1-2-3 structure on the chart, it draws the following elements:
Point labels (1, 2, 3)
Numbers in small rectangles, attached to local extremes:
- Point 1 — start of the impulse move.
- Point 2 — end of the impulse, top (for bullish pattern) or bottom (for bearish).
- Point 3 — pullback point. After it forms and is confirmed, we expect continuation in the direction of point 2 and beyond.
Stage 2 (early): only points 1 and 2 are drawn. The line between them is dashed. This is the "premonition" of a setup: the impulse is visible, we're waiting for the pullback. Label color is dimmed.
Stage 3 (confirmed): all three points 1, 2, 3 are in. Lines are solid, labels are bright. This is a confirmed formation, ready to trade.
Lines between points
- Line from 1 to 2 — this is the so-called "impulse leg." Its size is used to calculate all the other levels (pullback and targets).
- Line from 2 to 3 — this is the "pullback leg." Appears only on Stage 3.
OTE zone (Optimal Trade Entry) — the yellow rectangle
This is the most important zone on the entire chart. The rectangle is filled with semi-transparent yellow and labeled "OTE" in the center. It sits between Fibonacci levels 0.618 and 0.786 of the impulse leg (the "deep pullback" area).
Why exactly here:
- The 0.618-0.786 zone is mathematically the optimal entry: price has pulled back deeply (so risk is minimal), but not so deeply that structure is broken.
- Large algorithmic systems use this zone — so it works not because of "number magic," but because of self-fulfilling prophecy.
- Inside the OTE runs the 0.705 level (golden middle of the zone) — a separate dotted line. This is a favorite spot for many SMC traders.
3.4. Trade plan — Entry, SL, Target levels
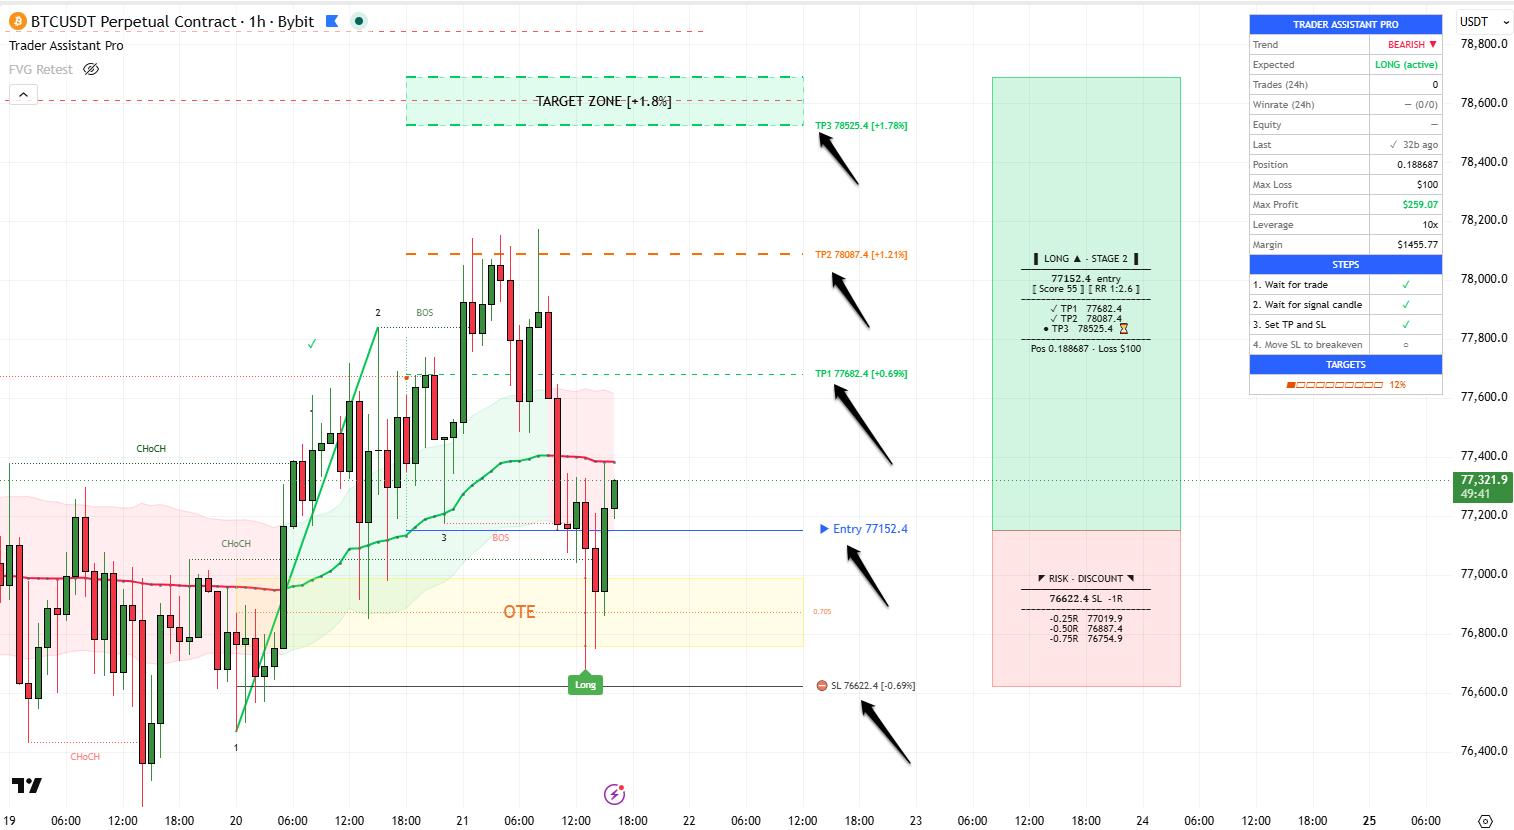
When the setup reaches full readiness (this happens when price returns into the OTE zone), the indicator automatically draws the complete trade plan:
Entry — entry point
Blue solid line labeled "▶ Entry [price]". This is the level your position is calculated from. When we get to the chapter on opening trades, I'll explain how to use it — for now, remember: entry isn't made just by touching this line, you still need confirmation.
SL — stop-loss
A solid black or white line (depending on theme) labeled "⛔ SL [price] [-X.XX%]". This is the level below which the formation is considered broken. If price gets there — the trade closes at a loss, and that's normal, that's how systematic trading works.
TP1, TP2, TP3 — three take-profit levels
Three horizontal lines of different colors:
| Level | Color | Location (Fibonacci) | Purpose |
|---|---|---|---|
| TP1 | Dark green (narrow) | Extension 0.886 — about 1R from Entry | First target. A good spot to close part of the position and move the stop to breakeven. |
| TP2 | Orange | Extension 0.272 | Intermediate target. Another partial close. |
| TP3 | Bright green (main) | Extension 0.5 | Final target. Remaining position closes fully here. |
1R is "one risk." If your stop sits 100 pips from entry — that's your risk, 1R. Then TP1 at 1R means the profit from the first target equals your stop. TP3 usually gives 2-3R of profit. This is the "risk/reward ratio" that makes the system profitable even at a winrate below 50%.
Target Zone — the green rectangle
A large semi-transparent green rectangle covering the area from Entry to TP3. In the center is the label "TARGET ZONE [+X.X%]" — potential profit as a percentage of price. A visual representation of "where we're aiming."
3.5. Info panels to the right of the chart
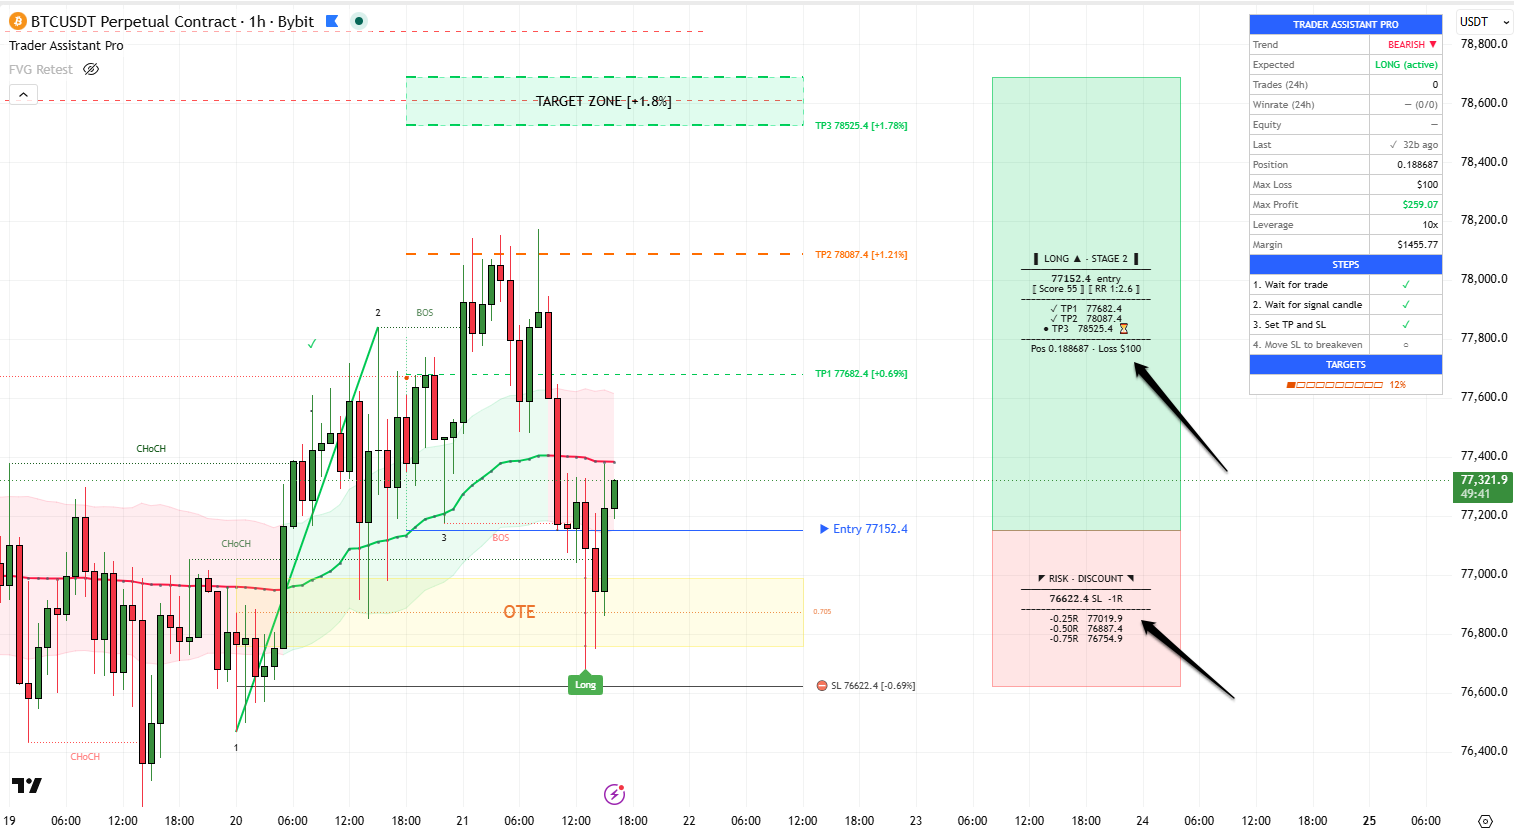
When a trade is active, two large colored info boxes appear to the right of the price action (beyond the candles). This is a unique Trader Assistant Pro feature — few indicators give such a detailed summary right on the chart.
Top panel (green) — trade plan and target list
Contains:
- Direction (LONG ▲ or SHORT ▼) and stage (STAGE 2 or STAGE 3).
- Entry price in large font.
- Pattern Score (quality rating) and Risk/Reward ratio.
- List of targets TP1, TP2, TP3 with their prices and status:
- ○ — target not yet reached
- ● ⏳ — nearest target, expected
- ✓ — target reached (checkmark appears automatically)
- Bottom: position size and maximum loss in your currency.
Bottom panel (red) — risk breakdown
Here the indicator shows the "risk ladder" — what happens if price goes against you:
- SL price and the "-1R" value
- Intermediate drawdown levels: -0.25R, -0.50R, -0.75R with their corresponding prices
Why this is useful: so you see ahead of time at what price level you'll lose a quarter/half/three-quarters of your risk. It helps you not panic when price moves against you — you understand that -0.5R is normal and the stop is still far away.
3.6. Signal elements — confirmations and touches
"Long" / "Short" pivot labels — main entry signal
When a reversal candle (local pivot) forms inside the SL↔Entry zone, the indicator draws a bright colored label:
- Green "Long" label below the candle: confirmed long entry signal.
- Red "Short" label above the candle: confirmed short entry signal.
Before the pivot label appears, the setup is considered pending — the indicator has prepared the plan, but it's too early to enter. The label appearing means: price gave a reversal signal inside the zone, so the buyer/seller reaction is now visible. From this moment the trade is officially open, and this is when you place the order on the exchange.
Colored dots on levels
Small dots (•) on the dotted pullback levels 0.5, 0.618, 0.705, and 0.786. They appear when price touches the corresponding level. Color — white on dark theme, black on light theme.
What they show: how deep the pullback was. If there are dots on all four levels — the pullback was a "test," price went down to the very bottom of the OTE zone. If only on 0.5 — the pullback was shallow. The deeper the pullback and the closer to 0.786, the stronger the "buy-up" and the potentially more powerful the following move.
Trade result markers (✓ / ✗)
After a trade closes, a small marker appears on the chart:
- Green ✓ — trade closed in profit (TP reached, or closed by trailing in profit).
- Red ✗ — trade closed in loss (stop hit).
These markers accumulate in the chart history and let you visually assess how often the system wins on your instrument.
3.7. Dashboard in the corner — your control panel
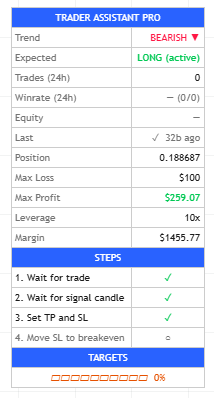
A large info table in the chosen corner of the chart. We'll cover it in detail in Chapter 9; for now, briefly on the structure:
- Header "TRADER ASSISTANT PRO" — blue title.
- Block 1: Trend, Expected — current market state and expected action.
- Block 2: Trades, Winrate, Profit Factor, Last — your stats over the chosen period.
- Block 3: Position, Max Loss, Max Profit, Leverage, Margin — parameters of the current active trade.
- "STEPS" block — step-by-step trade checklist with checkboxes.
- "TARGETS" block — progress bar showing price movement toward final target TP3.
3.8. Quick color reference
To avoid confusion, keep this color palette in mind:
| Color | What it means |
|---|---|
| Green | Bullish direction, long, profit, success |
| Red | Bearish direction, short, loss, danger |
| Yellow | OTE zone — entry point, waiting for reaction |
| Blue | Entry line |
| Orange | TP2 — intermediate target |
| Gray | Neutral state, no trend, background information |
Now that you know what's what on the chart, let's break down how the indicator actually detects setups. You need to understand this to trust the system.
Chapter 4. How the "1-2-3" Pattern Works
To trust the system, you need to understand its logic. In this chapter we'll break down what the 1-2-3 pattern is, why it works, and why the indicator opens trades specifically in the 0.618-0.786 Fibonacci zone. No heavy math, just plain explanations.
You can trade by the indicator without deep theoretical understanding — it does all the markup for you. But if you understand WHY the pattern works, you better distinguish strong setups from weak ones, don't panic in drawdowns, and don't close trades too early. So: 10 minutes on this chapter will pay off many times over.
4.1. What the 1-2-3 pattern is, in plain words
Any trending market move develops in waves: impulse — pullback — impulse — pullback, and so on. The 1-2-3 pattern describes one such basic structure: one impulse plus one pullback, after which the next impulse is expected.
Bullish version (for a long):
- Point 1 — local low. Price started rising from this level.
- Point 2 — local high. Here the impulse move stopped, sellers showed up.
- Point 3 — pullback point. Price pulled back down, but NOT below point 1 (this is critically important). Buyers are expected here, who will continue the move up to new highs.
Bearish version (for a short) — mirror image:
- Point 1 — local high. Price started falling.
- Point 2 — local low. Buyers showed up, the move stopped.
- Point 3 — bounce point. Price bounced up, but NOT above point 1. Resumption of falling is expected.
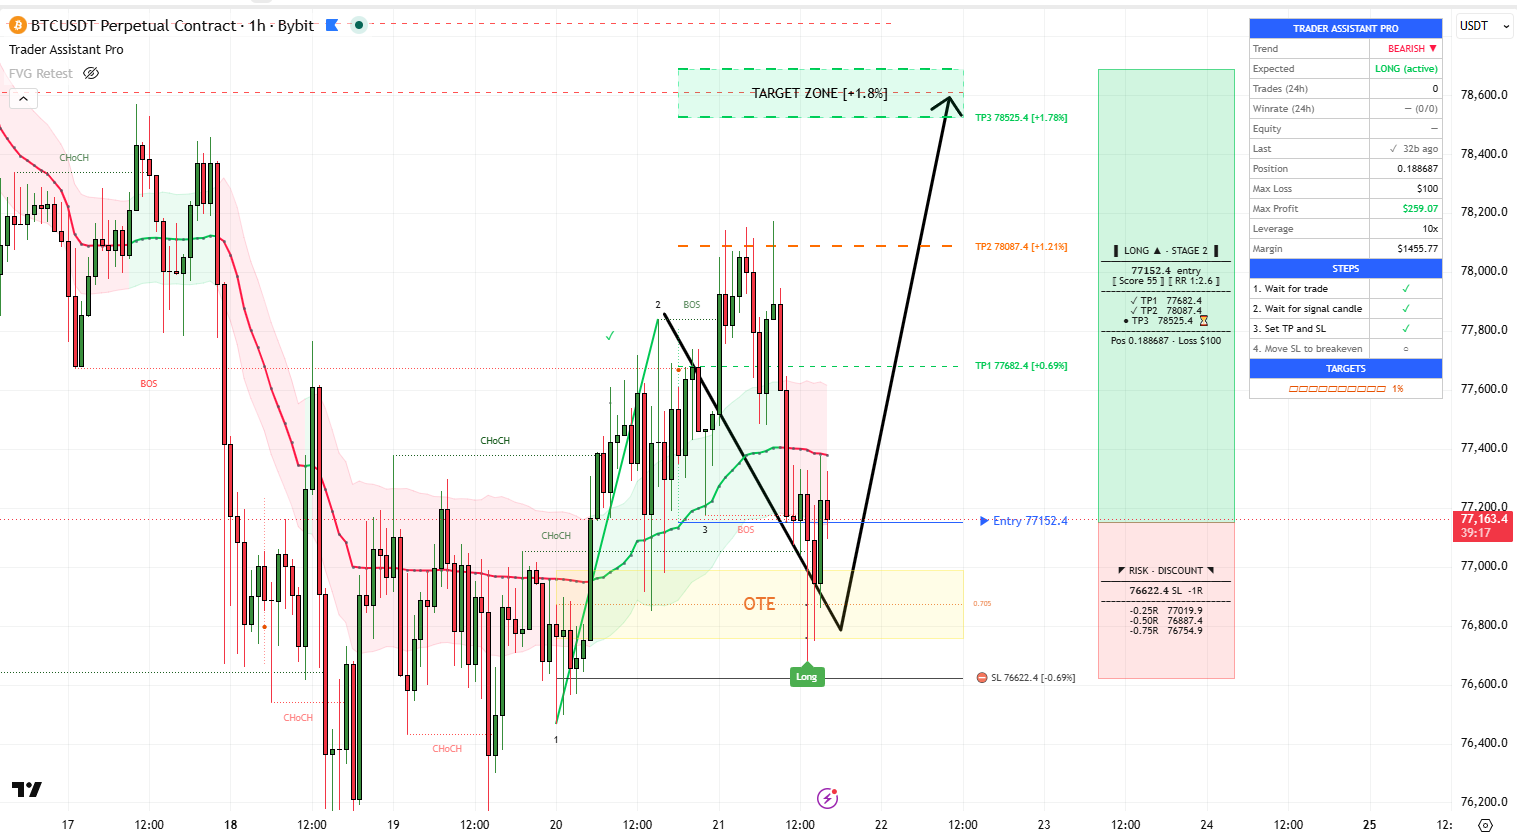
4.2. Why the pattern works — market psychology
The 1-2-3 pattern isn't "number magic" — it reflects real market participant psychology. I'll explain on a bullish setup (everything is mirrored for bearish):
- Impulse 1→2: a large buyer starts working, price rises, others join in — a "buying avalanche" kicks off.
- Stop at point 2: early buyers start taking profit, sellers appear. Impulse fades.
- Pullback 2→3: weak buyers panic-close their positions, short-term shorts open new ones — "that's it, the move is over." Large players, seeing the bigger picture, wait patiently for a better price.
- Accumulation at point 3: price reached the 0.618-0.786 zone of the impulse — this is the "discount zone," a deep but not critical pullback. Here large players start buying aggressively. Visually it's that signal candle (pivot) the indicator reacts to.
- New impulse: large players' buying traps weak shorts. They're forced to close positions via buying — adding to the impulse, price shoots up sharply and often reaches projections 1.272 or 1.618 of the original move.
The 1-2-3 pattern works not because Fibonacci numbers are magical, but because the 0.618-0.786 zone is where "smart money" buys back in and "dumb money" gives up positions. It's a structural phenomenon that has repeated millions of times across all markets in all eras.
4.3. Why exactly 0.618 and 0.786 — the Fibonacci numbers
Fibonacci levels (0.236, 0.382, 0.5, 0.618, 0.705, 0.786, 0.886) are mathematical ratios based on the "golden ratio." Traders have used them since the mid-20th century, long before algorithmic systems existed.
Two things matter here:
- These levels don't work "on their own." If traders didn't use them, they'd just be numbers. But because millions of traders and thousands of algorithms place orders in exactly these zones, liquidity really does concentrate there. This is self-fulfilling prophecy in its purest form.
- The 0.618-0.786 zone is a compromise between two extremes. A pullback to 0.382 (shallow) often turns out to be a "trap" — price drops further. A pullback to 1.0 (the entire impulse wave) means structure is broken and no continuation will follow. The 0.618-0.786 zone, however, is a "deep but healthy" pullback, after which continuation follows with high statistical probability.
What's inside the OTE zone
The indicator highlights several levels inside the yellow OTE rectangle:
| Level | What it is | How to use |
|---|---|---|
| 0.5 | Half of the impulse | First possible entry point (aggressive) |
| 0.618 | Top edge of OTE zone (for long) | Standard entry level |
| 0.705 | "Heart" of OTE zone | Favorite of many SMC traders — dotted line |
| 0.786 | Bottom edge of OTE zone | Deep entry with minimal risk |
| 0.886 | Stop-loss level | If price breaks it — formation broken, exit |
If the stop were placed right past the extreme at point 1, the risk would be too big — the stop-loss would be huge. At 0.886, price is still formally inside the pullback zone, but purely statistically — if it's broken, the pattern won't play out anymore. It's the mathematically optimal balance between a "safe stop" and a "favorable risk."
4.4. Stage 2 vs Stage 3 — why the indicator distinguishes stages
When points 1 and 2 appear on the market (the impulse), the indicator can already predict the future setup — that's Stage 2 (early formation). When point 3 is added (pullback confirmed), the setup moves to Stage 3 (confirmed).
Why these stages exist
The logic is simple: the earlier you know about a potential trade, the more time you have to prepare. But early information is always less reliable than late information. Stage 2 says "a setup in this direction might come soon." Stage 3 says "the formation is confirmed, get ready to enter."
What changes visually when moving from Stage 2 to Stage 3
| Element | Stage 2 (early) | Stage 3 (confirmed) |
|---|---|---|
| Point labels | Dimmed color | Bright color |
| 1→2 line | Dashed | Solid |
| 2→3 line | Absent | Solid |
| OTE zone label | "OTE" | "OTE" (no change) |
| Dashboard | "Expected: ... (pending)" | "Expected: ... (armed)" when ready to enter |
Beginners — strictly Stage 3 only. Fewer trades, but significantly higher winrate.
Advanced traders — can catch Stage 2 too, but only with additional confirmations (HTF Trend in the right direction, FVG in the entry zone, support/resistance). This gives the "fattest" entries — but requires experience.
You can control stages via the Min Pattern Score parameter (a higher threshold filters out weak Stage 2) and Stage 3 Only in the alert settings.
4.5. What can break the pattern
Even the prettiest formation can fail to play out. Here are the main causes:
1. Pullback too deep
If price crosses 0.886 — the formation is considered broken. The indicator automatically removes it from the chart and resets the trade plan. This is normal and happens regularly — some setups always fail, that's the price for the ones that bring profit.
2. News spike
Any pattern breaks in a single candle on strong news. Solution: watch the economic calendar and don't trade during major events (central bank meetings, employment data, inflation, etc.).
3. Counter-trend
A pattern against the general trend fires less often than with the trend. That's exactly why we enabled the Trend Filter in Chapter 2 — it cuts off most counter-trend setups.
4. Low liquidity
On thinly traded instruments or during low-activity hours (e.g., the Asian session for European stocks), patterns often turn out to be "fakes." Solution: only trade liquid instruments during active sessions.
5. "Leg" too big
If the 1→2 impulse was abnormally large (e.g., after a news gap), the formation is considered "broken" — the indicator filters such setups itself via the Max Wave Size parameter.
4.6. What Pattern Score is and why it matters
Not all 1-2-3 formations are equally reliable. Some look like a textbook picture, others like a sketchy imitation. The indicator scores each formation on a 100-point scale — that's Pattern Score.
The formula accounts for several factors:
- Pullback quality (main factor). The closer point 3 is to the ideal 0.618 level, the higher the score. Pullbacks too shallow or too deep get a low score.
- Impulse leg size. Too small an impulse — formation built on "noise," low score. Medium-sized impulse relative to current volatility — optimal.
- Symmetry and proportions. If the formation looks "right" — without abnormal skew of points relative to each other — a bonus is added.
How to read Score
| Score range | Setup quality | What to do |
|---|---|---|
| 85+ | Excellent — textbook example | Trade confidently, can increase position share within 1% rule |
| 60-84 | Good | Standard setup for trading |
| 40-59 | Average | Only with additional confirmations (HTF, FVG) |
| 30-39 | Weak — borderline | Skip, unless context is very strong |
| Below 30 | Very weak | Indicator will filter these via Min Pattern Score parameter |
High Score doesn't guarantee profit on a specific trade. It means that across a large sample of such setups, statistical expectation is positive. A Score 90 trade can hit the stop, and a Score 45 trade can blow through all targets. But if you only trade Score 60+, your overall statistics will be better than trading everything.
4.7. Quick summary
- 1-2-3 pattern = impulse + pullback + expectation of move continuation.
- OTE zone (0.618-0.786 Fibonacci) — statistically favorable entry zone.
- Stage 2 — early formation, Stage 3 — confirmed. Beginners — Stage 3 only.
- Pattern Score 60+ — good setup. Below 40 — better to skip.
- The pattern works most of the time, but not always. That's normal and accounted for by the risk management system.
Now that the theory is clear, let's break down the most important thing — the step-by-step trade entry algorithm.
Chapter 5. The Full Trade Cycle — Step by Step
This is the most important chapter of the entire guide. Here we'll cover, end to end, how to open, run, and close a trade using the indicator. If you only absorb this chapter and skip all the others — you'll already be trading better than 80% of retail traders. Come back here as often as you need.
The steps described below apply to ANY trade on any instrument and any timeframe. The principles don't change. That's the power of the systematic approach: you execute the same protocol over and over, and the statistics do all the work.
5.1. Six trade steps — overview
The full cycle from a potential setup appearing to position close consists of six steps:
- Wait for the setup to form (OTE zone and trade plan appear).
- Check the context and setup quality (Score, Trend, confluence).
- Wait for price to return into the OTE zone.
- Wait for the pivot label (signal candle) — this is the entry moment.
- Open the order on the exchange with the right size, place SL and TP.
- Manage the trade: move stops, close partially at targets.
Heads up: the indicator's dashboard has a STEPS block with four items — this is a simplified version of the same process, which the indicator tracks automatically. The six guide steps map to the four STEPS like this:
Guide steps 1 + 2 + 3 (formation, check, waiting for return) → STEPS "Wait for trade"
Guide step 4 (pivot label) → STEPS "Wait for signal candle"
Guide step 5 (order opening) → STEPS "Set TP and SL"
Guide step 6 (management, breakeven move) → STEPS "Move SL to breakeven"
So the guide breaks the process down in more detail — to make it clear what to do at each sub-stage. STEPS is the indicator's high-level checklist.
Let's go through each step.
5.2. Step 1. Wait for the setup to form
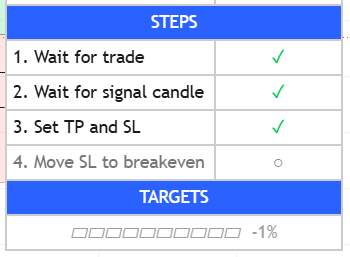
This step is fully automatic — the indicator will detect a suitable formation and draw it itself. Your job is to just glance at the chart sometimes (or wait for an alert, if you have them set up).
How to know a setup appeared
- A yellow OTE zone appeared on the chart.
- Point labels 1, 2, 3 are visible (or just 1 and 2 for Stage 2).
- Entry, SL, TP1/TP2/TP3 lines are drawn.
- Green and red info panels appeared to the right of the chart.
- In the dashboard, "Expected" switched to LONG (pending) or SHORT (pending).
- In the STEPS block, a checkmark appeared next to item 1.
Setup formation only means the indicator spotted a potentially interesting situation and prepared a plan for you. The mere appearance of an OTE zone isn't a reason to rush and open a trade. You need to wait for the next steps.
5.3. Step 2. Check the setup quality
Not every setup is worth trading. Before preparing to enter, spend 30 seconds on a quick check. This is the most important filter between an "average trader" and a "systematic trader."
Quality checklist (5 confluence points)
In the tooltip next to the colored dot on the info panel, the indicator itself shows "confluence" — how many confirmations align. The more — the stronger the setup. Here are the 5 factors:
- Pattern Score high enough. High-quality formation by indicator criteria. The star threshold is stage-aware: Stage 3 needs Score ≥ 60, an early Stage 2 needs ≥ 45 (its scoring scale tops out lower).
- Trend Aligned. Trend Bands match the trade direction (green for long, red for short).
- HTF Trend Aligned. Price is on the "right" side of the HTF Trend line (above — for long, below — for short).
- FVG Nearby. There's a Fair Value Gap near the entry point supporting the trade direction. This is an advanced filter, covered in Chapter 11.
- Stage 3. Formation is confirmed, not early.
| Confluence | Recommendation for beginner | For experienced |
|---|---|---|
| 5/5 | Definitely trade | A+ setup, can sometimes raise risk to 1.5% |
| 4/5 | Trade | Standard trade |
| 3/5 | Trade cautiously | Acceptable |
| 2/5 | Skip | Acceptable with strong context |
| 0-1/5 | Definitely skip | Skip |
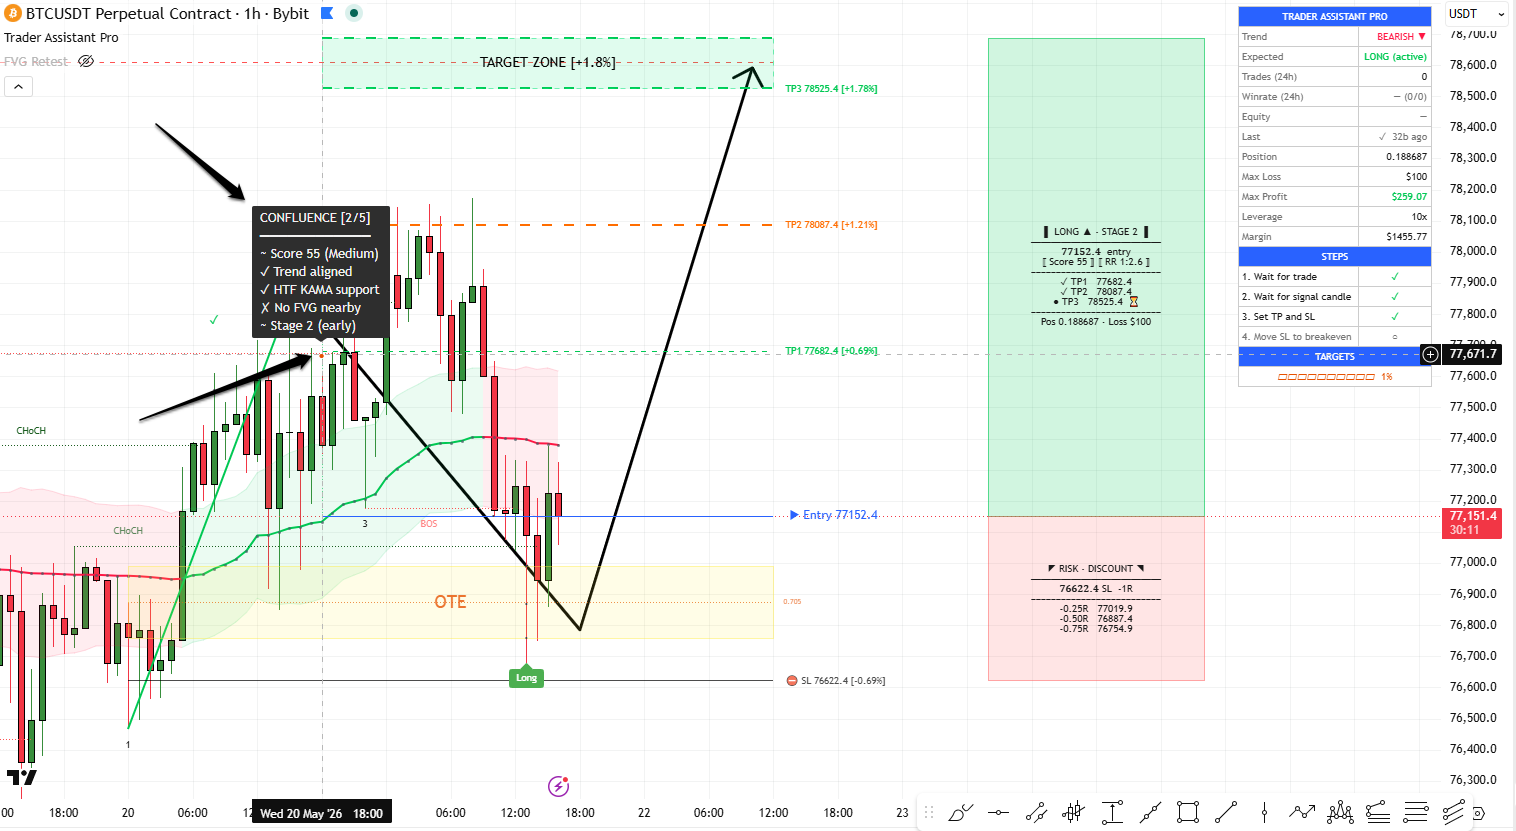
Additional "eye" checks
Beyond the automatic confluence, spend 10 seconds on manual verification:
- Are there any major news on this asset in the next hour (for crypto — broad market; for stocks — earnings)?
- Is price sitting on a strong support/resistance level that could halt the move?
- Is the time of day suitable (active session for your market)?
There are many setups per week. One missed setup won't break your statistics. One poorly chosen one — can wreck your discipline for a long time. The "when in doubt, don't" principle works flawlessly in trading.
5.4. Step 3. Wait for price to return into the OTE zone
After a setup forms, price rarely sits right at the entry zone — usually you have to wait for it to come back to OTE (the yellow rectangle).
What's happening on the chart
- If price is moving toward OTE — you'll see it approaching. This is the normal "pullback" process.
- When price touches the levels inside OTE (0.5, 0.618, 0.705, 0.786) — small colored dots appear.
- The dashboard switches Expected from "(pending)" to "(armed)" — the indicator is ready to confirm entry.
How long to wait
Depends on the market and timeframe. On the hourly chart, the return to OTE can take from several hours to a couple of days. On the 15-minute, usually within the same day.
What to do if price doesn't reach OTE
Sometimes price runs sharply away without bothering to pull back into the zone. This is called "setup didn't fire" — and it's completely normal, happens often. The indicator will remove the formation from the chart as soon as it's no longer relevant. You lose nothing — you simply didn't enter a trade that didn't happen.
The main temptation at this stage is to enter "after the train" when price has already broken point 2 without pulling back to OTE. DON'T DO IT. Without a pullback there's no proper entry, without a proper entry there's no proper stop, without a proper stop there's no risk management.
Wait for the next setup. They come regularly.
5.5. Step 4. Wait for the pivot label — the moment of truth
This is the critically important step that sets Trader Assistant Pro apart from most other indicators. An OTE zone appearing is not an entry signal. Touching the zone is not an entry signal. The signal is the appearance of a colored "Long" or "Short" label inside the SL↔Entry zone.
What a pivot label is
A pivot is a local price reversal — a candle that became the low (for a long) or high (for a short) surrounded by several neighboring candles. When such a reversal candle forms inside the trade zone, the indicator draws:
- Green "Long" rectangle below the candle — for a bullish setup.
- Red "Short" rectangle above the candle — for a bearish setup.
Why wait for the pivot, not just OTE touch
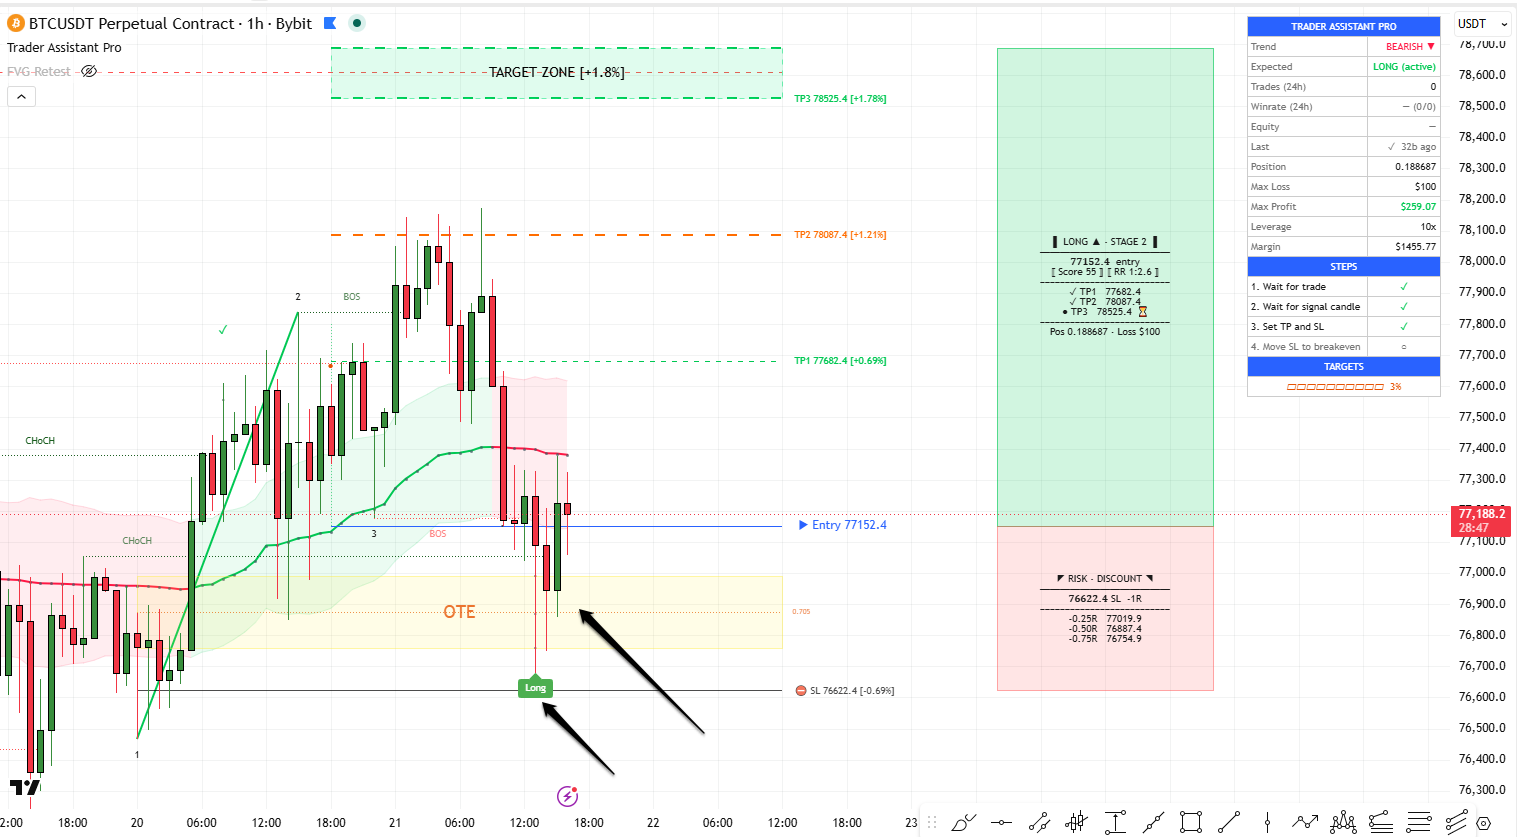
A thousand times price touches a zone and doesn't reverse, continuing all the way to the stop. The pivot candle is the first visual confirmation that buyers/sellers actually showed up in the zone and are "defending" the level. Without this confirmation, entry is a lottery.
Simple analogy: you're waiting for a bus. The schedule (OTE zone) says it should arrive. But until you actually see the bus (pivot), you can't get on — schedules sometimes slip.
1. Pivot appeared — this is YOUR moment. Now act fast, no second-guessing (everything's been thought through already).
2. In the dashboard, the STEPS block will check off item 2 ("Wait for signal candle").
3. Expected in the dashboard switches to "(active)."
5.6. Step 5. Open the order on the exchange
Pivot appeared — time to open the position. At this step the indicator has already calculated everything for you, all that's left is to carefully copy the numbers to the exchange.
What to take from the indicator
| Field | Where to get it in the indicator | What to enter on the exchange |
|---|---|---|
| Side | Pivot label (Long or Short) | Buy for long, Sell for short |
| Order type | — | Market or Limit at Entry price |
| Entry price | Blue Entry line on chart or Entry in info panel | Used with Limit; for Market — skip |
| Position size | Position in the dashboard | Copy exactly as shown |
| Stop Loss | SL line on the chart (marked ⛔) | Copy the price to exchange's SL field |
| Take Profit | TP1, TP2, TP3 lines | Create 3 separate TP orders or one at TP3 — see below |
Market or Limit — which to choose
Both options are valid, pick by situation:
- Market: if the pivot has already closed and price hasn't moved much (within 0.2-0.3% of Entry). Guarantees execution, but with slippage.
- Limit (at Entry price): if price is still close to Entry or you want exact execution by plan. Downside — the limit order might not fill if price runs without you.
Position size — the most important thing
The "Position" field in the dashboard shows the EXACT position size you need to open. This size already accounts for:
- Your deposit (Account Balance in settings)
- Configured risk (Allocation %)
- Distance from Entry to SL
- Leverage
If the indicator says "0.043 BTC" — open exactly 0.043, not 0.05 "for the round number." Any round-up = risk overrun.
Rounding down (e.g., 0.043 → 0.04) is acceptable and safe.
Three TP orders or one — partial close strategies
Since the indicator gives three targets, the optimal strategy is partial close at each TP. This lets you lock in profit progressively and reduce risk, leaving a "runner" for a potentially big move.
Strategy A (recommended for beginners): "50/30/20"
- At TP1: close 50% of position, move SL to breakeven
- At TP2: close another 30%
- At TP3: close the remaining 20%
Pros: half the profit is already locked at TP1 (when the trade is at 1R). Psychologically very comfortable. After TP1, the trade can no longer become a loser.
Strategy B ("classic"): "33/33/33"
- At each TP we close one-third of the position.
- SL moved to breakeven after TP1.
Pros: we hold the main position longer, bigger potential profit. Con: we lock less at TP1 — psychologically a bit tougher.
Strategy C ("aggressive"): TP3 only
- One order closing the entire position at TP3.
- SL not moved, or moved by trailing.
Pros: maximum profit when target is reached. Cons: high stress, frequent "reached TP2 and reversed" cases, significant risk of giving back all profit.
Start with Strategy A (50/30/20). It's the most psyche-friendly option. After 50-100 trades, once your nervous system is used to P&L swings, you can try Strategy B. Strategy C — better not to use ever, it leaves too much profit on the table.
5.7. Step 6. Trade management
After opening an order and placing SL/TP, you can't leave the trade unattended — you need to react to its development in time. Good news: the indicator itself tells you when to do what.
What to track
- Reaching TP1. This is the first and most important event. After TP1 — close part of the position (per your chosen strategy) and move SL to breakeven.
How the indicator signals the breakeven move
When TP1 is reached, the indicator automatically:
- Puts a checkmark next to TP1 in the right info panel (✓ TP1 [price]).
- Changes the label at the Entry line — "SL→BE" appears next to it (meaning "the stop should now be at breakeven").
- In the dashboard, checks off item 4 of STEPS ("Move SL to breakeven").
In the exchange terminal, edit the existing stop order: change the price from where the SL was to your entry price.
From this moment, worst case you exit at zero (with fees — a small minus). No news or reversal scares you anymore — huge psychological comfort.
Many exchanges support "trailing stop" — automatic stop movement. But I recommend moving manually after TP1 — gives more control.
- Reaching TP2. Close more position per chosen strategy. SL usually stays at breakeven (or can be tightened to +1R if you use advanced trailing — see below).
- Reaching TP3. Close the remaining "runner." Congrats — trade executed by plan.
What to do if price doesn't reach targets
SL hit before TP1
The saddest but inevitable event. Just accept the loss and don't try to "get even" immediately. A ✗ marker appears on the chart — that's history, important for stats. No emotions, move on.
SL hit after breakeven move
Closed at zero (or slight minus from fees). This is normal and happens often. A ✓ marker might appear on the chart — because the indicator counts "close after BE with TP1 already taken" as a winning trade.
Price stuck between TP1 and TP2 for a long time
If several days have passed (on hourly TF) and price isn't moving toward either target or stop — it's a "zombie trade." Sometimes it's better to close it by hand than to hold a "hanging" position for weeks, taking up attention and margin. The choice is always yours.
5.8. Advanced trailing-stop
The indicator has additional levels of automatic trailing-stop: automatic move to +1R and +2R as targets are approached. By default these levels are off, but they can be enabled in the "🎯 123 — Trailing Stop" group. The specific trigger percentage values are configurable there — I recommend first checking the default values and leaving them, changing only if you understand why.
| Level | Default | What it does | When to enable |
|---|---|---|---|
| Move to BE at % of TP | Enabled | Moves stop to breakeven when TP1 is reached | Always (base protection) |
| Enable +1R trail | Disabled | As price approaches TP3, moves stop to +1R | After TP2 — guarantees minimum +1R profit |
| Enable +2R trail | Disabled | On the final stretch of the move, moves stop to +2R | In strong moves — guarantees large profit |
If you use Strategy A (50/30/20) — advanced trailing isn't critical, you're already locking profit at intermediate TPs.
If you use Strategy C (TP3 only) — definitely enable at least the +1R trail so you don't give all profit back to the market.
On average: for crypto and strong trending moves, enabling +1R trail improves overall results. In a sluggish market — can lead to premature closes.
5.9. Record results and analyze
Trade closed — now what? Don't open the next one right away, even if a new setup is already forming on the chart. First record the result and make sense of what happened.
What the indicator does automatically
- Adds the result to statistics (Trades and Winrate in the dashboard update).
- Updates the R-based statistics — Trades, Winrate and Profit Factor in R-multiple.
- Places a ✓ or ✗ marker on the chart — for visual history analysis.
- Updates the "Last" row — how many bars ago the last trade closed and what the result was.
What you should do yourself
- Log the trade in your journal (separate Excel or Notion table — covered in Chapter 10).
- If the trade was a loss — calmly analyze: what was wrong with the setup? Was Score low? Counter-trend? News?
- If profitable — analyze too: was everything done per plan or were there deviations?
- Pause for at least 1-2 candles (hour or two) before looking for the next setup. This lowers emotionality.
The most dangerous psychological state is right after a losing trade. You want very much to "get back," enter with bigger risk, break the rules. That's tilt.
Hard rule: after 3 losses in a row — pause at least 24 hours. After 5 in a row — pause for a week and review the settings/strategy. This has saved more accounts than any system.
5.10. Full trade example — putting it all together
To cement the material, let's walk through a hypothetical trade end to end. Imagine you're trading BTCUSDT on the hourly chart.
Monday, 14:00 — setup formation
After a prolonged price decline, the indicator detected a formation: point 1 at 65,200, point 2 at 67,800, point 3 around 66,600 (0.618 pullback). On the chart appears a yellow OTE zone, with Entry at 66,700, SL at 65,850, TP1 at 67,850, TP2 at 68,250, TP3 at 68,700. Setup Score — 72.
14:00 — quality check
Looking at confluence: Score 72 (Strong) ✓, Trend bullish ✓ (Trend Bands green), HTF Trend support ✓ (price above the dotted line), FVG nearby ✗, Stage 3 ✓. Total 4/5 — good setup, we trade.
14:00-17:00 — waiting
Price drifts sideways around 67,200. This is normal. Waiting for the return into the OTE zone. Note: while price hasn't entered the SL↔Entry zone, you can calmly do your own business — the indicator tracks everything.
17:00 — price in the zone
Price dropped to 66,750, touched the 0.5 level in the OTE zone. A white dot appeared at this level. In the dashboard, Expected became "LONG (armed)."
18:00 — pivot!
On the hourly bar a reversal pattern formed (long lower wick, price went down to 66,500 and closed back at 66,900). The indicator drew a green "Long" label. In STEPS a checkmark appeared next to item 2.
18:01 — order opening
You look at the dashboard: Position = 0.087 BTC. You open Market Buy at 0.087 BTC at price 66,900. Immediately you set:
- Stop Loss at 65,850 — for the full 0.087 BTC volume
- Take Profit 1 at 67,850 — for 50% volume (0.043 BTC)
- Take Profit 2 at 68,250 — for 30% volume (0.026 BTC)
- Take Profit 3 at 68,700 — for the remainder 0.018 BTC
Tuesday, 03:00 — TP1 reached
Price reached 67,850. The exchange automatically closed half the position with about $42 profit. You get a push notification, open the terminal, and move the remaining SL from 65,850 to 66,900 (entry = breakeven). From this moment, worst case you exit at zero.
Tuesday, 09:00 — TP2 reached
Price 68,250, another 30% of position closed, profit about $35. The remaining 20% keeps working.
Tuesday, 14:00 — TP3 reached
Price reached 68,700, the last runner closed with about $31 profit. Total profit ~$108 vs. initial risk of $87. Trade executed perfectly per plan.
On the chart
A green ✓ marker appeared. In the dashboard, Winrate improved, Profit Factor recalculated. Last shows "✓ 0b ago."
Notice — in this example there wasn't a single emotional decision. Each action was prescribed by the system. You didn't "guess" price would go up — you simply executed the algorithm. That's exactly why this approach delivers stable results.
Of course, not every trade works out perfectly. But if you execute the algorithm the same way on every trade, statistics do the work for you.
Congrats — you just went through a full trade cycle. Now let's discuss how to pick your entry strategy.
Chapter 6. Three Entry Strategies: From Conservative to Aggressive
In previous chapters we covered the base algorithm. But you have a choice: trade only the perfect setups (few trades, high winrate) or catch everything that moves (many trades, lower winrate). This is a question of personal temperament and style, and the indicator flexibly tunes to either approach.
In this chapter I'll offer three ready presets. Pick the one closest to your character and current experience — and use it as a starting point.
It's important to understand from the start: there are no universal "best" settings. What works great on 1H BTCUSDT might give too much noise on 15M EURUSD or too few setups on 4H gold.
The presets below are reasonable starting points. After 50-100 trades on your instrument you'll feel what needs tweaking. This is a normal adaptation process.
Experiment principle: change only one parameter at a time and observe at least 20-30 trades before concluding anything.
6.1. What you can configure
Before giving the presets, let's break down what each key parameter does. So you understand the logic behind my recommendations.
Min Pattern Score
Minimum formation quality score below which the indicator won't show the setup. Default 30. The higher — the fewer setups, but of better quality.
| Value | Effect | Who it suits |
|---|---|---|
| 30 (default) | Almost all formations visible, including average ones | Experienced traders with good context analysis |
| 50 | Only above-average setups | Standard mode |
| 60 | Only good setups | Recommended for beginners |
| 75+ | Only excellent setups | For those wanting rare but "fat" entries |
Stage 2 Min Wave (× ATR)
Minimum size of impulse leg for early Stage 2 formations (in ATR multiples). Default 0.8. The higher — the less "small stuff" in early setups.
| Value | Effect |
|---|---|
| 0.5 | Many early formations, including on small moves |
| 0.8 (default) | Balanced |
| 1.2 | Only large impulses |
| 2.0+ | Stage 2 barely shows, only Stage 3 remains |
Trend Filter
Trade direction filter by trend.
| Value | Effect |
|---|---|
| Off | Trades both longs and shorts regardless of trend |
| Trend Bands | Only in Trend Bands direction (recommended for beginners) |
| Swing Structure | By structural trend (BOS/CHoCH) — stricter filter |
Max Wave Size (× ATR)
Maximum impulse leg size — if larger, formation is filtered out. Default 8.0. Protects from "giant" setups after news spikes where SL/TP would be absurdly wide.
| Value | Effect |
|---|---|
| 4.0 | Strict filter, cuts off all "large" formations |
| 8.0 (default) | Balanced |
| 20.0+ | Practically no limits |
Apply Min Wave to Stage 3
By default the Stage 2 Min Wave threshold filters only early (Stage 2) formations — a confirmed Stage 3 pattern is accepted with any wave size from below. This switch applies the same minimum to Stage 3 as well. Fewer trades, but every one of them rides a wave of meaningful size. The BTC and ETH presets use it; leave it off unless a preset or your own testing says otherwise.
Confluence Gate — min stars to trade
A hard quality filter on the trades themselves — covered in detail in 6.9. When enabled, a setup that collects fewer confluence stars than the threshold simply never becomes a trade.
Force-close stale trade after N bars
A trade that reaches neither SL nor TP within N bars (default 1000) is force-closed at the current price and recorded in the statistics with its actual result. This kills “zombie trades” that would otherwise hang for weeks and pollute the stats. On 24/7 crypto, 1000 15-minute bars is about 10 days; on session instruments (NIFTY, SPY) the same 1000 bars stretch to roughly 8 weeks of calendar time — consider lowering the value there.
6.2. Strategy A — Conservative (RECOMMENDED FOR BEGINNERS)
You're just starting and want to bet on quality, not quantity.
You have limited time to trade (not sitting at the screen all day).
You're emotionally sensitive — a streak of 3-4 losses throws you off.
You want to train your patience — a base trader skill.
Settings
| Parameter | Value | Why |
|---|---|---|
| Min Pattern Score | 60 | Only setups above the "good" threshold |
| Stage 2 Wave Mult | 0.8 (default) | Standard |
| Max Wave Size | 8.0 (default) | Protection from "giants" |
| Trend Filter | Trend Bands | Only with main trend |
| Allocation % | 1.0 | Safe risk |
| Sizing Mode | Risk-based | Safe mode |
| Trailing: BE at % of TP | Enabled | Base protection |
| Trailing: +1R, +2R | Disabled | Not needed with 50/30/20 strategy |
| Alerts Stage 3 Only | Enabled | Ignore early formations |
| Alerts Min Confluence | 3 | Only setups with 3+ confirmations |
Close strategy — 50/30/20
- TP1: close 50%, move SL to breakeven
- TP2: close 30%
- TP3: close the remaining 20%
What to expect from this strategy
- Trade count: low — usually a few per week on the hourly TF. This is normal and by design.
- Winrate: with strict rule execution, tends to the higher end — the strategy is designed to skip questionable and take only the best.
- Emotional load: minimal — you spend a lot of time doing nothing, just waiting.
- Main skill being trained: patience.
Specific winrate and trade count numbers heavily depend on the market, instrument, period, and how strictly you follow the filtering rules. One trader will get 70% winrate on BTC 1H, another 50% on EUR/USD 15m. This is normal. The main thing is a stable positive result over 50+ trades.
6.3. Strategy B — Standard
You already have at least 100 trades on the conservative strategy with a stable plus.
You want more activity — 2-5 trades a week feels too few.
Emotionally resilient to streaks of 5-6 losses in a row.
Ready to give trading more attention.
Settings
| Parameter | Value | Difference from conservative |
|---|---|---|
| Min Pattern Score | 40 | Lowered — more setups |
| Stage 2 Wave Mult | 0.6 | Slightly softer — more Stage 2 |
| Max Wave Size | 10.0 | Slightly wider |
| Trend Filter | Trend Bands | Keep — it's the foundation |
| Allocation % | 1.0 | Don't raise! |
| Sizing Mode | Risk-based | Don't change |
| Trailing: BE at % of TP | Enabled | Base protection |
| Trailing: +1R | Enabled | Add to hold profit |
| Trailing: +2R | Disabled | Optional |
| Alerts Stage 3 Only | Disabled | Catch Stage 2 too |
| Alerts Min Confluence | 2 | Lowered — more signals |
Close strategy — 33/33/33
- TP1: close 33%, move SL to breakeven
- TP2: close 33%, move SL to +1R (if autotrail fires — better through indicator)
- TP3: close remainder 34%
What to expect from this strategy
- Trade count: noticeably more than conservative — several per week, sometimes several per day in active periods.
- Winrate: lower than conservative (because the filter is softer and we take Stage 2), but winning trades on average run longer and RR compensates.
- Emotional load: medium — you have to make decisions more often.
- Main skill being trained: systematic execution.
6.4. Strategy C — Aggressive
I do NOT recommend this strategy to beginners. If you're reading this guide for the first time — skip this section and come back to it after 6 months of active trading.
Aggressive mode wears you down psychologically: many setups, many entries, longer loss streaks, requires fast decisions. This is a mode for those who already know themselves in trading.
When it suits
- Experienced trader with stable results on conservative/standard strategy.
- Ready to trade actively, spending several hours at the screen per day.
- Psychologically tolerates streaks of 7-10 losses.
Settings
| Parameter | Value | Logic |
|---|---|---|
| Min Pattern Score | 30 (default) | All setups above base threshold |
| Stage 2 Wave Mult | 0.5 | Small impulses too |
| Max Wave Size | 12.0 | Wide ranges |
| Trend Filter | Off | Trade both directions |
| Allocation % | 1.0 | Still not more! |
| Sizing Mode | Risk-based | Keep safety |
| Trailing: all three levels | Enabled | Mandatory for profit preservation |
| Alerts Stage 3 Only | Disabled | All formations |
| Alerts Min Confluence | 0 | No filter |
Even in aggressive mode, DO NOT raise Allocation %! This is the biggest mistake experienced traders make: "I'm already experienced, I can risk 3%."
Over a large sample of trades, raising risk doesn't proportionally increase profit, but drawdown size grows linearly. At 3% risk, a 7-loss streak eats 19% of the deposit. That's already a psychological catastrophe.
Want more profit — increase trade count, not size of each.
Close strategy — hybrid
- TP1: close 40%, move SL to breakeven
- TP2: close 20%, then +1R autotrail kicks in
- TP3: close remainder 40% or let +2R autotrail squeeze the max
What to expect from this strategy
- Trade count: high — on active days they can run back to back.
- Winrate: lower than on conservative — this mode works through volume of trades and advanced trailing, not through high accuracy.
- Emotional load: high — you need to react fast, loss streaks can be longer.
- Main skill being trained: emotional resilience and automatism.
6.5. Summary comparison table
| Criterion | Conservative (A) | Standard (B) | Aggressive (C) |
|---|---|---|---|
| Min Score | 60 | 40 | 30 |
| Trend Filter | Trend Bands | Trend Bands | Off |
| Stages | Stage 3 only | Stage 2 + Stage 3 | All |
| Close | 50/30/20 | 33/33/33 | 40/20/40 + trail |
| Trade frequency | Low | Medium | High |
| Winrate (tendency) | Above average | Average | Below average |
| Load | Low | Medium | High |
| Who it suits | Beginners, busy | Experienced | Pros |
| ℹ️ About specific numbers In real trading, winrate and trade count depend on the market, instrument, time of day, and period. Different traders on the same indicator get different numbers, and that's normal. So here I give tendencies rather than specific numbers — they're misleading because you'll have your own statistics. |
6.6. How to transition between strategies
Don't immediately start aggressive just because you want to trade more often. Natural trader development path:
- First dozens of trades — strictly Conservative (A). You learn to execute rules.
- Once you have stable plus on a large sample of trades and understanding that the system works — try Standard (B).
- After a significant period of trading Standard with positive results — you can consider Aggressive (C), if you need it at all.
Many of the world's best traders trade their whole lives on a "conservative" scheme and make huge money — just on big capitals. Don't confuse aggressiveness with professionalism.
Professionalism is system execution without errors, not size of risk.
6.7. Experimenting with settings
When you've mastered the base preset and want to experiment, do it right. A few practical tips:
Rule of one variable
Change only ONE parameter at a time. Otherwise it's impossible to understand what gave the effect. If you changed Min Score, don't touch Trend Filter at the same time.
Sufficient sample size
After a settings change, you need at least 30-50 trades for a statistically meaningful conclusion. Changing parameters every trade — road to nowhere.
Logging changes
In your trade journal, note which settings each trade was made with. So you can compare: "these 40 trades were at Score 60, these other 40 — at Score 50."
Adapting to the instrument
Different instruments behave differently:
- Crypto: usually works on standard settings. High volatility gives clean formations.
- Forex: often needs stricter Min Score (65-70), because of many small false moves.
- Stocks: important to account for sessions — settings should be tested only on active hours.
- Indices and futures: usually require slightly bigger Max Wave Size because of sharp session opens.
Never change settings in the middle of a trading streak (especially after losses). The urge to "set it better" after losses is an emotional reaction, not analysis. Change parameters in a calm state, by cold analysis, with the trade journal in front of you.
Now that the strategy is chosen, let's talk about the holy of holies — risk management.
6.8. Instrument Presets — a year of backtesting in one dropdown
Strategies A/B/C above are hand-built starting points. Presets are the opposite approach: machine-optimized parameter sets, one per instrument. For each of the 13 supported symbols, roughly 3.9 million parameter combinations were tested on a full year of 15-minute data (August 1, 2025 — July 29, 2026) using the audited v8.1 trade logic, and the most robust combination became the preset.
Pick a preset in ⚙️ 123 — Main → 🎯 Preset (instrument). “Custom” means “ignore presets, use my manual values below.”
What a preset overrides
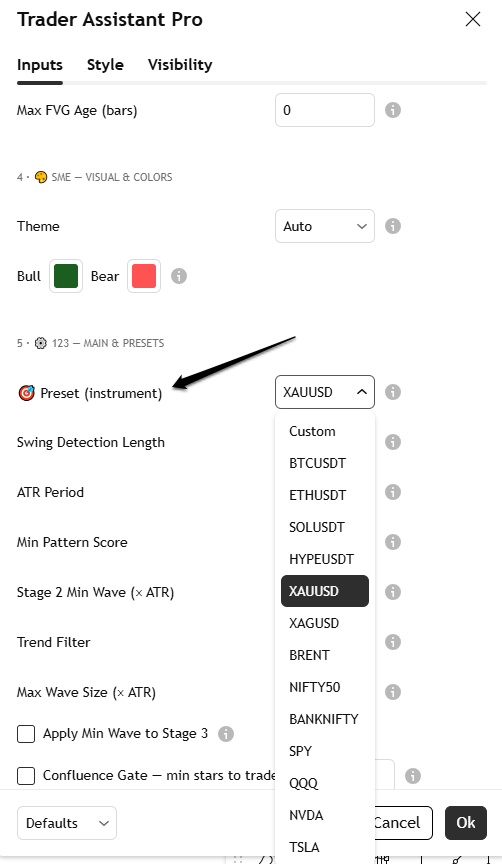
A preset takes control of the parameters that were part of the optimization grid. While a preset is active, changing these inputs manually has no effect — the preset value wins:
- 123 Swing Detection Length, ATR Period, Min Pattern Score
- Stage 2 Min Wave (× ATR), Max Wave Size (× ATR), Apply Min Wave to Stage 3
- Trend Filter (Trend Bands for all presets; NVDA uses Swing Structure) and the SME Swing Length it relies on
- Confluence Gate on/off and its star threshold
- Min FVG Size and Max FVG Age (presets that use the FVG confluence star set 0.15 × ATR and 200 bars)
Everything else — Risk Manager, trailing, visuals, alerts, dashboard — stays yours.
The ETH, SOL, HYPE, XAU, XAG and QQQ presets gate trades by confluence stars, one of which is “FVG nearby.” For that star to work, FVG detection runs automatically even if the FVG display toggle is off. You don't need to enable anything — and you won't see the gaps on the chart unless you want to.
How to work with presets
- Trade the preset on 15m first. That's the timeframe it was optimized on. On other TFs the preset is a reasonable starting point, not a tested configuration.
- Don't “improve” a preset by feel. If you want to experiment, switch to Custom, copy the values you liked, and change one variable at a time (see 6.7).
- Instrument not in the list? Use Custom with Strategy A/B/C from this chapter. Borrowing a preset from a “similar” instrument (e.g., SOL preset on another altcoin) may work, but treat it as untested.
The backtest behind the presets is in-sample: the parameters were chosen on the same year they were scored on. It ignores fees, funding and slippage, and counts breakeven exits as wins. That makes the numbers honest for comparing presets to each other — and optimistic as a forecast of your live results. Expect live performance below the table in 9.12, and verify on your own market before risking meaningful money. A year of data also cannot cover every regime the market will throw at you.
6.9. Confluence Gate — the filter that blocks trades, not alerts
Every trade gets a confluence count from 0 to 5 — the stars you see in the dashboard and in the entry tooltip: Score, Trend aligned, HTF KAMA support, FVG nearby, Stage 3. Until now you could only use that count to filter alerts. The Confluence Gate uses it to filter the trades themselves: if a setup collects fewer stars than the threshold at the moment it would open, the trade simply doesn't happen — no lines, no entry, no statistics entry.
- Enable: ⚙️ 123 — Main → “Confluence Gate — min stars to trade”, threshold 1-5.
- The Score star is stage-aware. A Stage 3 formation earns the star at Score ≥ 60; a Stage 2 formation at Score ≥ 45 (the Stage 2 scoring scale tops out lower, so a fixed 60 would make the star unreachable for early formations).
- FVG detection turns on automatically so the “FVG nearby” star always has data (see the box in 6.8).
Six of the thirteen presets ship with the Gate enabled (threshold 3 or 4) because the backtest showed it improves their profile. With the Gate on, expect noticeably fewer trades — that is the point.
Chapter 7. Risk Management: How Not to Blow Your Account
If you skip all chapters and read only this one — you'll already save yourself years and thousands of dollars. Most traders blow their account not because they're bad at predicting price moves, but because they distribute risk wrong. Good news: Trader Assistant Pro has a built-in risk manager that does almost all the work for you — you just need to configure it right and listen to it.
Risk management is more important than analysis. You can be a mediocre analyst with great risk management — and earn money. You can be a brilliant analyst with bad risk management — and go bankrupt. This is a mathematical fact, not my opinion.
7.1. Base principles — to be burned on your forehead
Principle 1: Never risk more than 1-2% of deposit per trade
This is the golden rule, breaking which will kill your account fastest. Logic is simple: even a good system gives loss streaks. If every trade can cost you 1%, a streak of 10 losses (it happens!) leads to a drawdown of about 9.5%. Painful, but not critical. At 5% risk, the same streak would take almost 40% of the deposit.
| Risk per trade | Drawdown after 5 losses in a row | Drawdown after 10 in a row | How much you need to earn to recover |
|---|---|---|---|
| 0.5% | 2.5% | 4.9% | 5% |
| 1% (recommended) | 4.9% | 9.5% | 10.5% |
| 2% | 9.6% | 18.3% | 22.4% |
| 5% | 22.6% | 40.1% | 67.0% |
| 10% (catastrophe) | 41.0% | 65.1% | 186.5% |
Notice the last column — that's how much you need to earn in percentages from the REMAINING deposit to return to the original level. With 65% drawdown you need +186% — almost impossible in reasonable time.
Principle 2: Risk is calculated from distance to stop, not from position size
This is the most common conceptual mistake of beginners. They think: "I'll open for 100 bucks, leverage 10x — my risk is 100 bucks." This is fundamentally wrong.
Real risk = (distance from Entry to SL) × position size. If you opened a long on 0.1 BTC at price 60,000, and set stop at 58,000 — your risk = (60000-58000) × 0.1 = $200, regardless of what margin you blocked and what leverage you used.
In Risk-based mode you tell the indicator: "I'm ready to lose $X on one trade." The indicator itself calculates position size so that the loss when stop hits is exactly $X, regardless of how wide or narrow the stop turned out to be on this specific formation.
In Margin-based mode you set margin size — and with a wide stop your real risk can be 3-5 times bigger than intended. That's the trap beginners fall into.
Principle 3: Never move the stop against yourself
"I'll move it just a bit, the market will reverse" — the most expensive phrase in trading. The stop is set once, before opening the trade, and you mustn't touch it after. Except in one case: moving it to breakeven or to +1R/+2R after passing the corresponding targets.
Principle 4: Never average a losing position
"Price dropped, I'll buy more — lower the average" — the second most destructive phrase. Averaging a loss means you're increasing risk in a losing trade. All professional traders do the opposite: average in profit (pyramiding), but not in loss.
7.2. How the indicator protects you
Automatic position calculation
The main Risk Manager feature is the "Position" field in the dashboard. This number is calculated by the formula:
Position Size = (Allocation % × Account Balance) ÷ (Entry – SL distance)
Example: deposit $5000, risk 1% = $50. Entry = 60000, SL = 58500. Distance = 1500. Position = 50 / 1500 = 0.0333 BTC. If the stop hits, you lose exactly $50.
Red "Max Loss" warning
If for some reason the calculated loss turns out to be abnormally big (e.g., you misconfigured parameters or the setup has a very wide SL), the "Max Loss" field in the dashboard is highlighted in red. This is a signal: DO NOT open this trade, check the settings.
"Insufficient Margin" warning
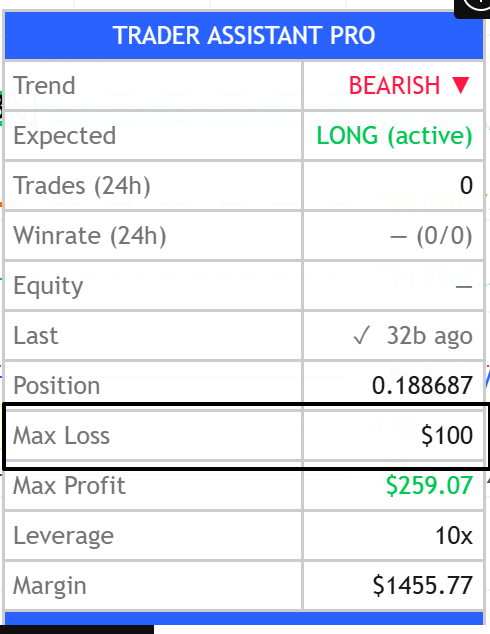
If in Margin-based mode the calculated margin exceeds available balance, a ⚠ icon appears after the value in the "Margin" field. This means — you physically don't have enough money on the exchange to open a position of this size. You need to either decrease leverage or decrease Allocation.
7.3. Leverage — friend or foe?
Leverage is one of the most misunderstood topics in trading. Most beginners fear leverage like fire ("10x is risky!"), although in reality leverage with proper risk management practically doesn't increase risk.
What leverage actually does
Leverage lets you open a position bigger than the money you have. If deposit is $1000 and leverage is 10x, you can open a position of $10,000. The exchange takes $1000 from you as collateral (margin), but you control a $10,000 position.
Where leverage is dangerous
Leverage is dangerous not on its own, but in combination with margin-based risk calculation without a stop. If you use Margin-based mode, open a position on all your margin, and don't set a stop — a price drop of just 10% at 10x leverage liquidates you fully.
Where leverage is safe
In Risk-based mode with a proper stop, leverage doesn't affect your real risk at all. You risk 1% of deposit, period. Leverage only affects how much margin will be blocked (the "Margin" field in the dashboard). The bigger the leverage — the less margin, the more free funds for other trades.
| Leverage | Position size | Blocked margin | Real risk (at SL 2%) |
|---|---|---|---|
| 1x (no leverage) | $1000 | $1000 | $20 |
| 5x | $5000 | $1000 | $100 |
| 10x | $10,000 | $1000 | $200 |
| 20x | $20,000 | $1000 | $400 |
This example is for Margin-based. See how real risk grows with leverage? That's exactly why I advise using Risk-based — there, position size is corrected to the desired risk, and leverage only affects margin.
Leverage recommendations
- Crypto: 5-20x — optimal range. Less — too much frozen margin, more — growing liquidation risk on extreme moves.
- Forex: 20-50x — traditionally uses large leverage due to low volatility.
- Indices and commodities: 5-10x is usually enough.
- Never use the exchange's max leverage (100x, 125x). That's a marketing trick, no professional trades like that.
7.4. Managing total portfolio risk
One percent per trade is the base. But if you have 5 trades open simultaneously at 1% each, your real risk is 5%. If all of them go against you (and on correlated markets it happens), the drawdown will match.
Portfolio risk rules
- Simultaneously open trades: no more than 3-4.
- Total risk of all open positions: no more than 4-5% of deposit.
- On one instrument: no more than 1 trade at a time (not "long on BTC and short on BTC" — that's pointless).
- On correlated instruments (BTC and ETH, or EUR/USD and GBP/USD): max 2 trades in one direction.
7.5. Drawdown and psychology
Even with a perfect system and perfect discipline you'll have drawdowns. This is mathematically inevitable. It's important to know which drawdowns are normal, and which are a signal that something went wrong.
| Drawdown | What it means | What to do |
|---|---|---|
| up to 5% | Normal working fluctuations | Nothing, keep trading |
| 5-10% | Light "bad luck streak" | Don't change strategy, continue |
| 10-15% | Serious drawdown | Reduce risk to 0.5% per trade, analyze journal |
| 15-20% | Alarm signal | Pause trading for 1 week, full setup review |
| 20%+ | Critical zone | Full pause in trading until causes are clear |
When you're in drawdown, your only correct action is to DECREASE risk, not increase it. Most beginners do the opposite — try to "get back" through bigger positions. This is exactly the moment when the account is blown for good.
7.6. Psychological tricks to keep you on track
Trick 1: Count in R, not dollars
Money is emotion. R (risk-unit) is an objective measure. A trade with $50 profit at $50 risk is +1R, and this measure doesn't depend on your deposit size. If you get used to thinking in R, you'll react more calmly to fluctuations.
Trick 2: Set daily and weekly stop-loss limits
Besides per-trade stop, set yourself a rule: if you lost 3% of deposit during the day — close the terminal until tomorrow. If you lost 5% in a week — pause until Monday. This saves you from cascade blowups in moments of emotional instability.
Trick 3: Keep an emotion diary
After each trade, write one line of your emotions: calm / nervous / greedy / fear / euphoria. In a month you'll see a pattern: losing trades correlate with certain emotions. This gives you material for self-development.
Trick 4: No trades after losses in a row
- 3 losses in a row → pause for a day
- 5 losses in a row → pause for a week + full system review
- Include these rules in your "trading constitution," written before the trading session starts.
7.7. Risk management checklist — verify before every trade
- Allocation % = 1.0 (or less) — DON'T raise in moments of emotion.
- Sizing Mode = Risk-based — DON'T switch to Margin-based until you've mastered risk management perfectly.
- Position in dashboard is reasonable — no more than a reasonable share of deposit.
- Max Loss not highlighted in red.
- Margin less than Free Balance on the exchange.
- No already-open trades in the same direction on correlated instruments.
- Today's trading session not blocked due to a loss streak.
Risk management is boring. It doesn't give adrenaline. It doesn't make you a "cool trader." But it's exactly what separates those who trade for 10 years straight from those who blow their account in 3 months. If you master only this chapter — you're already in the top-10% of all retail traders.
Next — alerts, so you don't sit at the screen all day.
Chapter 8. Alerts: How to Trade Without Sitting at the Screen
Nobody sits in front of a chart 24/7 — it's neither possible nor necessary. Trader Assistant Pro has a built-in notification system that pings you only when something actually happens: a trade plan appears, an entry is confirmed, the stop is moved to safety, the stop is hit, or a take-profit is reached. Set it up once — and you can calmly live, work, sleep, and travel, knowing you won't miss a setup that matters.
The alert system mirrors the STEPS checklist you see in the dashboard. Every alert is named after the step it belongs to, so a notification on your phone reads exactly like the checklist on your chart: Step 1 — a trade appeared; Steps 2-3 — the trade is confirmed, set your TP and SL; Step 4 — the stop has been moved; Step 5 — the stop was hit; Step 6 — a take-profit was reached. Below we break down every event, every filter, every field of every message, and exactly how to wire it all up in TradingView — both for manual trading and for a fully automated bot.
8.1. How the alert system is built
The indicator can notify you through two independent mechanisms. They are not competing options — you can run either one or both at once.
- The alert() engine. Automatic notifications the indicator composes and fires by itself. You create a single alert in TradingView (condition “Any alert() function call”) and the indicator decides when to send and what to write. Messages carry the complete trade card: direction, Entry, SL, all three TPs, R:R, Score, Stage, confluence, position size and maximum loss. Best for most people.
- Named conditions (alertconditions). Eighteen named signals that appear in TradingView's Create Alert → Condition dropdown. They let you build separate alerts per event and per direction (e.g., a push only for confirmed longs, or only for stop-outs). Their messages use TradingView placeholders (ticker, interval, current price) — Pine cannot inject the dynamic Entry/SL/TP levels into them, so for full trade cards use the engine.
The key to the whole system is the difference between the moments in a trade's life:
ARMED (Step 1, event trade_armed) — the formation passed its filters and the Confluence Gate, and the indicator drew the full trade plan: Entry, SL, TP1-TP3, OTE zone. Price has not yet printed the reversal candle. Important: the levels can still shift until entry (see 11.12).
CONFIRMED (Steps 2-3, event trade_opened) — price returned into the SL↔Entry zone and printed the “Long”/“Short” reversal candle. The levels are locked. This is the moment to act.
MANAGED (Step 4, event sl_moved) — the trailing engine moved your stop: to breakeven, then optionally to +1R and +2R. One separate alert per move.
CLOSED BY STOP (Step 5, event sl_hit) — price touched the stop and the trade is over. The indicator tells you which stop it was: the original one (a full loss of −1R) or a stop that trailing had already moved to breakeven, +1R or +2R (no loss, or even a small profit).
TAKE-PROFIT REACHED (Step 6, event tp_hit) — price touched TP1, TP2 or TP3. One alert per level, with the profit in R. TP3 is the final target: on that alert the trade is closed and the indicator clears its levels from the chart.
8.2. The alert() engine — five events
Everything for the engine lives in the 🔔 123 — Alerts settings group. Five on/off switches control five events. Three of them are on by default (Trade Confirmed, Stop Hit, TP Reached) — so straight out of the box one TradingView alert tells you when to enter and how the trade ended.
| Step | Switch in settings | JSON event | Default | Filters that apply |
|---|---|---|---|---|
| Step 1 | Alert: Step 1 — Trade Appeared (armed) | trade_armed | off | Direction, Min Score, Stage 3 Only, Min Confluence |
| Steps 2-3 | Alert: Trade Confirmed (pivot Long/Short) | trade_opened | on | Direction, Min Score, Stage 3 Only, Min Confluence |
| Step 4 | Alert: Step 4 — SL Moved (BE / +1R / +2R) | sl_moved | off | Direction only |
| Step 5 | Alert: Step 5 — Stop Hit (SL touched) | sl_hit | on | Direction only |
| Step 6 | Alert: Step 6 — TP Reached (TP1/TP2/TP3) | tp_hit | on | Direction only |
Alert: Trade Confirmed — the main alert (trade_opened)
Fires the moment a trade is officially confirmed — when a “Long” or “Short” reversal candle prints inside the SL↔Entry zone. From that instant the indicator considers the trade open. The message carries the full card: direction, Entry, SL, TP1-TP3, R:R, Score, Stage, confluence count, position size and maximum loss from your Risk Manager. On by default.
If you enable only one notification in the entire indicator — make it Trade Confirmed. It fires rarely (only when it is actually time to act) and carries everything you need to place the order without opening the chart. For most traders this single alert replaces hours of screen time.
Alert: Step 1 — Trade Appeared (trade_armed)
An early warning: the trade projection has just been built and is waiting for price to enter the zone. Unlike older versions of the indicator, this alert now includes the full level set (Entry, SL, TP1-TP3, R:R, Score, Stage, confluence) plus the line “⏳ Waiting for price to enter the zone”. Off by default.
A trade_armed alert means “a trade plan exists, come look” — not “open a position.” Until price touches Entry, point 2 keeps re-anchoring to new extremes and every level in the message can shift (see 11.12). Many armed setups never get confirmed at all. Treat Step 1 as a heads-up to be near your screen — nothing more.
Alert: Step 4 — SL Moved (sl_moved)
Fires each time the trailing engine moves your stop: to breakeven, and — if enabled in the 🎯 123 — Trailing Stop group — to +1R and to +2R. One alert per move, with the new SL price. Only the direction filter applies to this event (the quality filters were already passed at entry). Off by default; turn it on if you trail your stop on the exchange manually — the alert tells you exactly when and where.
Alert: Step 5 — Stop Hit (sl_hit)
Fires when price touches the stop and the indicator closes the trade. There are two very different cases, and the alert tells them apart. Full stop-out (🛑): price hit the original stop, the result is −1R — you lost exactly the risk you planned. Trailed stop (🛡): the stop had already been moved by trailing to BE, +1R or +2R, so the trade closed at zero or with a small profit — no loss. The message shows the direction, Entry, the stop price that was hit, the result in R and which stop it was (SL / BE / +1R / +2R). Only trades that were actually confirmed are reported — a Step 1 projection that never entered does not produce a Step 5 alert. Only the direction filter applies. On by default.
Your exchange stop should have fired at the same level — the alert confirms it, gives you the exact result in R for your journal, and catches the one case every beginner meets sooner or later: you forgot to place the stop. If a 🛑 alert arrives and your exchange position is still open, close it by hand immediately.
Alert: Step 6 — TP Reached (tp_hit)
Fires when price touches a take-profit level: TP1, TP2 or TP3. Each level sends its own alert with the level price and the profit in R measured from Entry, plus a hint about what comes next (“⏳ Next: TP2”). If one fast candle spikes through two levels, you get two alerts on the same bar. TP3 is the final target: its alert says “✅ Final target — trade closed”, and the indicator removes the trade from the chart. Only the direction filter applies. On by default.
With all five switches on, a winning long reads like this: 👀 Step 1 — Trade Appeared → 🔔 Trade Confirmed → 🛡 Step 4 — SL → BE → 🎯 TP1 Reached → 🎯 TP2 Reached → 🏁 TP3 Reached. A losing one is shorter: 👀 Step 1 → 🔔 Trade Confirmed → 🛑 Step 5 — Stop Hit (SL). You never have to open the chart to know where the trade stands.
8.3. Named conditions — eighteen signals in the dropdown
Beyond the engine, the indicator exposes eighteen named conditions in TradingView's Create Alert → Condition dropdown (the second field, after you pick “Trader Assistant Pro”). They follow the same Step naming:
| Condition | Fires on |
|---|---|
| 123 · Step 1 — Trade Armed (Any) | Any trade projection built (waiting for zone) |
| 123 · Step 1 — Trade Armed (Long) | LONG projection built |
| 123 · Step 1 — Trade Armed (Short) | SHORT projection built |
| 123 · Step 2-3 — Trade Confirmed (Any) | Any confirmed entry (reversal candle in zone) |
| 123 · Step 2-3 — Trade Confirmed (Long) | Confirmed LONG entry |
| 123 · Step 2-3 — Trade Confirmed (Short) | Confirmed SHORT entry |
| 123 · Step 4 — SL → BE | Stop moved to breakeven |
| 123 · Step 4 — SL → +1R | Stop moved to +1R |
| 123 · Step 4 — SL → +2R | Stop moved to +2R |
| 123 · Step 5 — Stop Hit (Any) | Any stop touched, trade closed |
| 123 · Step 5 — Stop Hit (Long) | A LONG was stopped out |
| 123 · Step 5 — Stop Hit (Short) | A SHORT was stopped out |
| 123 · Step 5 — Stop Hit — Full Loss (−1R) | The original stop was hit — a full −1R loss |
| 123 · Step 5 — Stop Hit — Trailed (BE/+1R/+2R) | A stop already moved by trailing was hit — no loss |
| 123 · Step 6 — Any TP Reached | Any take-profit level touched |
| 123 · Step 6 — TP1 Reached | TP1 touched |
| 123 · Step 6 — TP2 Reached | TP2 touched |
| 123 · Step 6 — TP3 Reached (Final) | TP3 touched — final target, trade closed |
Four things to know about these conditions:
- Direction is chosen by the condition itself. Pick “(Long)” and you get only longs — the Trade Direction Filter input is not needed here.
- The quality filters still apply. Min Pattern Score, Stage 3 Only and Min Confluence Count (see 8.4) gate the Step 1 and Step 2-3 conditions exactly as they gate the engine, so both mechanisms stay in sync.
- Step 4, 5 and 6 conditions have no filters at all. They report what happened to a trade that was already opened — and a trade that passed your filters at entry deserves to be followed to the end.
- Messages use placeholders, not trade levels. Pine cannot inject dynamic Entry/SL/TP values into alertcondition messages — you get the ticker, timeframe and current price. If your bot needs the levels, use the engine in JSON (8.5) or custom alert texts (8.6).
A formation can tentatively appear and dissolve within a live bar. The engine is protected by its once-per-bar-close throttle; the Step 1 named conditions carry an equivalent internal guard, so even if you set your TradingView alert to a “once per bar” frequency, you will not be pinged by a phantom formation that vanishes before the close. Step 5 and Step 6 conditions are only ever raised on closed bars by design.
8.4. Alert filters — taming the flood
All filters live in the 🔔 123 — Alerts group. They combine with AND logic: a notification is sent only if every active filter passes.
| Filter | Range / options | What it does | Suggested |
|---|---|---|---|
| Trade Direction Filter | Both / Longs only / Shorts only | Limits which directions notify. Applies to all five engine events, including sl_moved, sl_hit and tp_hit. | Both |
| Min Pattern Score for Alerts | 0–100 | Suppresses notifications below this setup Score. | 60 |
| Stage 3 Only | on / off | Only confirmed Stage 3 formations notify; early Stage 2 is muted. | On |
| Min Confluence Count | 0–5 | Requires at least N of 5 confluence stars (Score, Trend, HTF KAMA, FVG nearby, Stage 3). | 3 |
Applicability at a glance: trade_opened and trade_armed obey all four filters; sl_moved, sl_hit and tp_hit obey only the direction filter (their quality was checked at entry — a trade you were told to open will always be followed to its end). The named Step 1 / Step 2-3 conditions obey the three quality filters, with direction fixed by the condition name; the Step 4, 5 and 6 conditions have no filters.
Don't confuse Min Confluence Count with the Confluence Gate from chapter 6.9. The Gate blocks the trades themselves — a gated setup never appears on the chart and never enters the statistics. The alert filter only decides whether to ping you about a trade that does exist on the chart.
8.5. Message format — Text vs JSON
A single Message Format switch (Text / JSON) controls how the engine writes all five events. Text is for humans; JSON is for machines.
Text — human-readable
A clean, labelled message you can read at a glance on your phone. Example of a Trade Confirmed message:
Entry: 66900.0
SL: 65850.0
TP1: 67350.0 · TP2: 67650.0 · TP3: 68350.0
RR 1:1.4 · Score 72 · Stage 3 · Conf 4/5
Pos 0.087 · Loss $87.00
The same trade closed by the original stop (Step 5, full loss) and closed by a stop that trailing had moved to breakeven:
Entry: 66900.0
SL: 65850.0
Result: -1R · full stop-out
Entry: 66900.0
SL: 66900.0
Result: 0R · closed on a trailed stop
And the take-profit alerts (Step 6) — the first level and the final one:
TP1: 67350.0 · +0.43R
⏳ Next: TP2
TP3: 68350.0 · +1.38R
✅ Final target — trade closed
JSON — for bots and webhooks
A structured payload your bot can parse field-by-field. The five events look like this:
{"event":"trade_opened","symbol":"BTCUSDT","tf":"15","dir":"LONG",
"entry":66900.0,"sl":65850.0,"tp1":67350.0,"tp2":67650.0,"tp3":68350.0,
"rr":1.4,"score":72,"stage":3,"confluence":4,"pos":"0.087","max_loss":"$87.00"}
{"event":"trade_armed","symbol":"BTCUSDT","tf":"15","dir":"LONG",
"entry":66900.0,"sl":65850.0,"tp1":67350.0,"tp2":67650.0,"tp3":68350.0,
"rr":1.4,"score":72,"stage":3,"confluence":4}
{"event":"sl_moved","symbol":"BTCUSDT","tf":"15","dir":"LONG",
"level":"BE","new_sl":66900.0}
{"event":"sl_hit","symbol":"BTCUSDT","tf":"15","dir":"LONG",
"entry":66900.0,"sl":65850.0,"level":"SL","result_r":-1,"outcome":"loss"}
{"event":"tp_hit","symbol":"BTCUSDT","tf":"15","dir":"LONG",
"tp":1,"price":67350.0,"r":0.43,"final":false}
Field reference:
| Field | Meaning |
|---|---|
| event | trade_opened / trade_armed / sl_moved / sl_hit / tp_hit |
| symbol / tf | Ticker and timeframe the alert fired on |
| dir | LONG or SHORT |
| entry / sl | Entry price and stop-loss price |
| tp1 / tp2 / tp3 | The three take-profit levels |
| rr | Risk:reward to TP3, rounded to one decimal |
| score | Pattern Score, 0–100 |
| stage | 2 (early) or 3 (confirmed formation) |
| confluence | Confluence count, 0–5 |
| pos / max_loss | Position size and maximum loss from your Risk Manager settings (trade_opened only) |
| level / new_sl | Trailing step (BE / +1R / +2R) and the new stop price (sl_moved only) |
| level / result_r / outcome | Which stop was hit (SL = the original stop, or BE / +1R / +2R), the result in R, and the outcome: loss (full stop-out) or protected (closed on a trailed stop) — sl_hit only |
| tp / price / r / final | Take-profit number (1, 2 or 3), the level price, the profit in R, and final = true when it was TP3 and the trade is closed — tp_hit only |
trade_opened and trade_armed carry the same level fields, so a naive bot cannot tell them apart by shape. Always branch on event: execute on trade_opened, prepare (or ignore) on trade_armed, adjust the stop on sl_moved, take partial profit or close on tp_hit (close everything when final is true), log the result and reset on sl_hit. Executing on trade_armed means trading levels that may still move.
8.6. Custom alert texts for bots — your own message format
Many trading bots and services (3Commas, Cornix, Alertatron, WunderTrading, or a script you wrote yourself) expect a message in their own exact format — a specific command line or a specific JSON shape — not the indicator's built-in text. The 🤖 123 — Custom Alert Texts (Bots) settings group lets you write your own message for every event. You type a template with placeholders such as {{ticker}} or {{entry}}, and the indicator fills them in with real values at the moment the alert fires.
How it works
- Turn on Use custom alert texts. Below it are seven text fields, one per event: Step 1 — Trade Armed, Step 2-3 — Trade Confirmed, Step 4 — SL Moved, Step 5 — Stop Hit, Step 6 — TP1 Reached, TP2 Reached, TP3 Reached.
- Type your template into the field for the event your bot needs. Leave a field empty and that event keeps the built-in text (or JSON) — so you can override only the events your bot understands and keep normal messages for the rest.
- All the usual filters still apply (Direction, Min Score, Stage 3 Only, Min Confluence), and the five switches from 8.2 still decide whether an event fires at all. Custom texts change what is written, never when.
Placeholders you can use (write them exactly like this, with double curly braces):
| Placeholder | Filled with |
|---|---|
| {{ticker}} | Ticker without the exchange, e.g. BTCUSDT |
| {{symbol}} | Full symbol with the exchange prefix, e.g. BINANCE:BTCUSDT |
| {{exchange}} | Exchange prefix only, e.g. BINANCE |
| {{tf}} | Chart timeframe the way TradingView writes it: 15, 60, 240, D |
| {{close}} | Close price of the bar the alert fired on |
| {{dir}} / {{dir_lower}} | LONG or SHORT / long or short |
| {{entry}} / {{sl}} | Entry price and the current stop price |
| {{tp1}} / {{tp2}} / {{tp3}} | The three take-profit levels |
| {{rr}} | Risk:reward to TP3 |
| {{score}} / {{stage}} / {{conf}} | Pattern Score, Stage (2 or 3) and the confluence count (0–5) |
| {{level}} | Step 4: the trailing step (BE / +1R / +2R). Step 5: the stop that was hit (SL / BE / +1R / +2R) |
| {{r}} | Result in R — the loss on Step 5 or the profit on Step 6 |
| {{price}} | The main price of the event: Entry (Steps 1 and 2-3), the new stop (Step 4), the stop that was hit (Step 5), the take-profit level reached (Step 6) |
| {{tp}} | Take-profit number 1, 2 or 3 (Step 6 only) |
A placeholder that has no value for a given event is replaced with nothing — it simply disappears from the message. On the Step 5 bar the take-profit levels are already wiped, so {{tp1}}–{{tp3}} come out empty; on the TP3 bar the trade is closed, so {{entry}}, {{sl}} and {{tp1}}–{{tp3}} may be empty too. If your bot needs those numbers at the end of a trade, let it remember them from the earlier Trade Confirmed message.
Examples
A one-line entry command for a bot (Step 2-3 field):
ENTER-{{dir}}_{{exchange}}_{{ticker}}_MYBOT_{{tf}}M
For a long on Binance BTCUSDT on the 15-minute chart this arrives as:
ENTER-LONG_BINANCE_BTCUSDT_MYBOT_15M
A Step 4 template that tells the bot where to move the stop, and a Step 6 template for a Telegram log:
MOVE-SL {{ticker}} {{dir_lower}} {{price}} ({{level}})
{{ticker}} {{dir}} TP{{tp}} hit at {{price}} → +{{r}}R
When a custom text is set for an event, it replaces both the Text and the JSON version of that event. If your bot wants JSON, write the JSON yourself in the template — placeholders work inside braces just as well, for example {"cmd":"enter","side":"{{dir_lower}}","pair":"{{ticker}}","sl":{{sl}}}.
Create the alert, wait for one real event (or temporarily set Min Score to 0 on a busy pair to get one sooner) and read exactly what arrived. One wrong character in a bot command means the bot ignores it — or, worse, does something you did not intend. Only when the message looks right, point the webhook at a live account.
8.7. Creating an alert in TradingView — step by step
Method A — one all-in-one alert (recommended)
- In the indicator settings, 🔔 123 — Alerts group: check that Alert: Trade Confirmed is on, set your filters (and Message Format = Text for manual trading).
- On the chart press Alt+A (or the clock icon → Create Alert).
- Condition: “Trader Assistant Pro” → “Any alert() function call”.
- Expiration: Open-ended (paid TV plans) or maximum available.
- Notifications: check Push (mobile app), optionally Email.
- Name it, e.g. “TAP BTCUSDT 15m”, and Create.
Done. One alert now delivers every engine event you enabled — Trade Confirmed, Stop Hit and TP Reached by default, plus Step 1 / Step 4 if you switched them on. The indicator decides what to send; you never need to touch the TradingView alert again, even after changing filters.
Method B — named conditions (per direction / per step)
Same dialog, but in the Condition dropdown pick a specific named condition, e.g. “123 · Step 2-3 — Trade Confirmed (Long)”. Create one alert per condition you care about. Use this when you want separate push channels per direction, or a different sound for entries and for stop-outs.
TradingView freezes the indicator settings into the alert at creation time. If you later change a filter, a preset, the Risk Manager inputs or a custom alert text, delete and re-create the alert — otherwise it keeps firing on the OLD settings. This is a TradingView rule, not an indicator limitation.
8.8. Where to send alerts
- TradingView mobile app (recommended). Free push notifications, arrive in seconds. Enable “Notify in app” + “Push”.
- Email. A backup channel; can lag by minutes. Fine for Step 1 heads-ups, too slow as the only channel for entries.
- Telegram via webhook. Needs a paid TV plan (webhook access) and a small relay bot; delivers JSON straight to your chat or channel.
- Discord. Same webhook mechanics via a Discord webhook URL.
8.9. Webhooks and bot automation
For automation, set Message Format = JSON (or write custom texts in your bot's own format, 8.6) and point the TradingView alert's Webhook URL at your endpoint. The endpoint parses the payload and acts on the event field. A minimal safe loop: trade_opened → place the entry order with SL and TPs from the payload; sl_moved → amend the stop; tp_hit → take the partial profit, and close everything when final is true; sl_hit → log the result and reset; trade_armed → log it, nothing else. Position sizing is already in the payload (pos), computed from your Risk Manager settings — but verify it against your own account state server-side before sending an order to the exchange. Never trust a single message with your whole account.
8.10. Recommended alert setups
- Manual beginner. Engine only: Trade Confirmed, Stop Hit and TP Reached on (the defaults), Step 1 and Step 4 off, Stage 3 Only on, Min Score 60, Min Confluence 3, Text format. One ping when it's time to act, then pings that tell you how the trade ended — nothing to watch in between.
- Discretionary with early warning. Same as above, plus Step 1 on (or a named “Step 1 — Any” alert). Two pings before the trade: “get ready” and “go”. Add Step 4 if you move stops manually on the exchange.
- Bot / automation. Engine in JSON to a webhook, all five events on, filters as your strategy dictates. Route by the event field; execute only trade_opened. If your bot needs its own command format, use custom alert texts (8.6).
8.11. What to do when an alert arrives
An alert is an invitation to run your checklist — not an order to click Buy. When a Trade Confirmed ping lands:
- Open the chart. Verify the trade is still active (price hasn't already hit SL or run to TP1 while you slept).
- Check where price is relative to Entry. Still near Entry — proceed. Already far above (long) — the R:R has degraded; skip or wait for a retest (see the FAQ).
- Run the pre-trade checklist from chapter 12: risk sized, no news in the next hour, daily limit not reached, no tilt.
- Place the order with the exact SL and TPs from the message. Then let the plan work.
A Step 1 ping means “look, don't touch”; a Step 4 ping means “move your exchange stop to the level in the message — now”; a Step 5 or Step 6 ping means the trade (or part of it) is closed — check that the exchange did the same, write the result in your journal, and do not re-enter on emotion.
Chapter 9. The Dashboard — Your Onboard Computer
The dashboard in the chart corner is one of the best features of Trader Assistant Pro. One compact table holds all key info: current market state, your stats, active trade parameters, step-by-step checklist and progress to target. Most indicators either don't have a dashboard at all, or show one or two metrics. Here — a full control center.
9.1. Dashboard structure
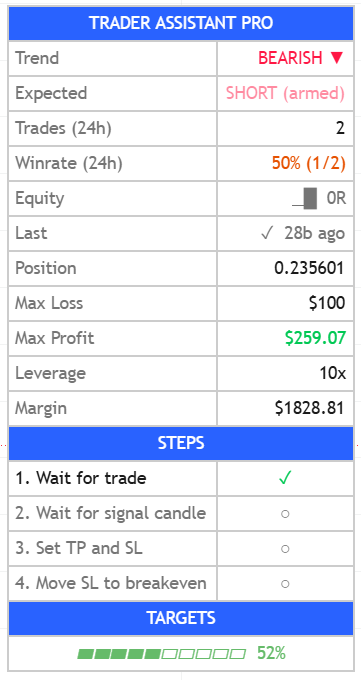
The dashboard consists of several logical blocks separated by blue header bars:
- Header — indicator name
- "Market State" block — current trend and expected action
- "Statistics" block — your trades, winrate, profit factor
- "Active Trade" block — open position parameters
- "STEPS" block — step-by-step trade checklist
- "TARGETS" block — progress bar to final target
9.2. "Market State" block
Trend
Current Trend Bands trend. Shows one of three states:
- BULLISH ▲ (green): uptrend
- BEARISH ▼ (red): downtrend
- NEUTRAL — (gray): no clear trend
Expected
What the indicator "expects" to do right now. Can be in several states:
| Value | What it means |
|---|---|
| LONG / SHORT | Current trend allows a trade in this direction, no formations yet |
| LONG (pending) / SHORT (pending) | Setup formed, waiting for price return to OTE |
| LONG (armed) / SHORT (armed) | Price in OTE zone, waiting for pivot signal |
| LONG (active) / SHORT (active) | Trade open, running to targets |
| WAIT | No trend, no formation — indicator "expects nothing" |
Confluence
A star rating that shows how many of the five confluence checks the current (armed or active) setup passes. Displayed as filled/empty stars plus a count, e.g. ★★★★☆ 4/5. When there is no setup, it shows "—".
The five checks are: Pattern Score (≥ 60 for Stage 3, ≥ 45 for Stage 2 — the early-formation scale tops out lower), Trend alignment (Trend Bands), HTF KAMA support, a Fair Value Gap nearby, and Stage 3 (confirmed formation). The more stars, the more independent factors agree with the trade.
Confluence is the same 0–5 score that drives the Min Confluence Count alert filter. A pending setup with 4–5 stars is worth your full attention; 1–2 stars means the factors disagree — treat it with extra caution or let your filters skip it.
9.3. "Statistics" block
Trades
Number of trades for the chosen stats period (24h, 7d, 30d, or All — configured in the "📊 123 — Dashboard" group).
Winrate
Percentage of winning trades for the same period. Shown as "X.X% (W/T)", where W is wins, T is total trades.
- Green color: winrate ≥ 60%
- Yellow-orange: winrate 40-59%
- Red: winrate below 40% — time to think
Profit Factor — quality of your R stream
Profit Factor (PF) is the sum of all positive trade results divided by the sum of all negative ones, both measured in R, over the chosen stats period. PF 2.0 means winners brought in twice as much R as losers gave back. Breakeven exits (0R) are excluded from both sides of the ratio; fees and funding are not included — this is the strategy's raw R stream.
- Green: PF ≥ 1.5 — a healthy edge.
- Yellow-orange: PF 1.0–1.5 — positive but thin; fees can eat it.
- Red: PF below 1.0 — the period is net-losing; time to analyze.
- ∞: no losing trades in the period yet (small sample — don't celebrate).
Winrate tells you how often you win; PF tells you whether the wins are worth it. A 40% winrate with PF 1.8 is a good system. A 70% winrate with PF 0.9 is a slow bleed. Read them together, and only on 30+ trades — below that, both numbers are noise.
Last
When the last completed trade was and what the result was. Format: "✓ Nb ago" or "✗ Nb ago", where N is the number of bars since closing.
- If the last trade is a loss and closed less than 5 bars ago — color is red. This is the "heightened caution period" — don't rush opening a new trade.
- Green — last trade profitable (recent).
- Gray — long ago or neutral.
9.4. "Active Trade" block
Filled only when you have an open (or prepared) trade. If there's no trade — all fields show "—".
Position
Exact position size to open on the exchange. Accounts for deposit, risk, distance to stop, leverage. This is the number you need to enter in the order's "Quantity" field.
Max Loss
Maximum loss in your currency if the stop hits. Highlighted in red if it falls outside the safe range relative to deposit (Max Loss warning).
Max Profit
Maximum profit in your currency if price reaches TP3. Always green.
Leverage
Leverage you set in the settings. Informational field — needs to be checked against the exchange's leverage.
Margin
Margin (collateral) that will be blocked on the exchange for this trade. Highlighted in red with a ⚠ icon if it exceeds available balance.
9.5. "STEPS" block — step-by-step checklist
This is a unique feature of the indicator that literally walks you through the trade. Four items with checkmarks or circles:
| Step | When the checkmark appears |
|---|---|
| 1. Wait for trade | Trade zone appeared (Entry, SL, TP drawn) |
| 2. Wait for signal candle | Long/Short pivot label appeared — trade confirmed |
| 3. Set TP and SL | Matches step 2 (after pivot — you set orders on the exchange) |
| 4. Move SL to breakeven | Trailing-stop fired (TP1 reached, SL moved to breakeven) |
Every time you look at the dashboard, check: which step is currently active? What should I do? It's very disciplining — you can't "forget" a stage when it's flashing at you with an empty circle.
9.6. "TARGETS" block — progress bar
At the very bottom of the dashboard — a horizontal progress bar of 10 "blocks" (▰▱). Shows how close price is to the final target TP3.
- Each block = 10% of the path from Entry to TP3
- ▰ — covered part, ▱ — remaining
- Right of it, a number — exact percentage covered
Progress color indication
| Stage | Color | Meaning |
|---|---|---|
| Before TP1 | Yellow-orange | Early stage, nothing interesting |
| TP1 reached | — | Time to move SL to breakeven |
| Between TP1 and TP2 | Light green | Partially closed, move continues |
| TP2 reached | — | Another partial close |
| Between TP2 and TP3 | Dark green | Final stretch |
| TP3 reached (100%) | Gold | Close everything, celebrate |
| Negative value | Gray | Price moved toward SL |
9.7. How to read the dashboard: typical scenarios
Scenario 1: "I just turned on the terminal in the morning"
Looking at the dashboard:
- Trend = BULLISH
- Expected = LONG (pending)
- Trades over 24h = 1, Winrate = 100%, day result +1R
- Last = ✓ 8b ago
Interpretation: trend is bullish, long trade expected, waiting for confirmation. Yesterday there was one winning trade. A good workday, nothing urgent to do — waiting for the setup.
Scenario 2: "A trade is open, how's it going"
- Expected = LONG (active)
- Position = 0.087
- Max Loss = $87
- STEPS: 1 ✓, 2 ✓, 3 ✓, 4 ○
- TARGETS: ▰▰▰▱▱▱▱▱▱▱ 30%
Interpretation: trade is working, has covered a third of the way to TP3, TP1 not reached yet. Will be soon — get ready to move SL to breakeven (step 4).
Scenario 3: "I'm on a bad streak"
- Trades over 7d = 12, Winrate = 33%, week result -5R
- Last = ✗ 2b ago (in red)
- Profit Factor for the period below 1.0
Interpretation: streak of bad luck, need to stop. By the rules from Chapter 7 — pause for a day, journal analysis, possibly lower risk to 0.5%.
Scenario 4: "A dangerous trade"
- Position = 0.155
- Max Loss = $312 (RED)
- Margin = $1550 ⚠ (RED)
Interpretation: the indicator warns — this trade breaks your risk management. Don't open it. Check whether you accidentally set too high an Allocation %, whether this formation has a too-wide SL, whether you have enough margin.
9.8. The main thing about dashboard statistics (must read)
This is the section often skipped — then people are surprised. Read carefully.
The dashboard shows statistics of VIRTUAL trades, calculated like this: "if a trader had opened on the pivot label and closed at TP3 or SL — that would have been such a trade." This is statistics of the SYSTEM, not of you.
Your real statistics differ from the indicator's always, and usually — for the worse. Reasons:
• You miss some setups (e.g., no push notification on time, were driving, sleeping)
• You have slippage (entered worse than Entry, stopped out worse than SL)
• The exchange takes fees and spread
• You sometimes close before TP manually (out of fear) or don't reach TP at all
• You sometimes break rules (entry without confirmation, moved stop — see Chapter 10)
So: DON'T EXPECT your real winrate to match what's in the dashboard. The real gap is usually 10-20% against you.
What to do about it
- Keep YOUR journal of real trades (see Chapter 10.12). Only it shows your real statistics.
- Use the dashboard as an indicator that the system is HEALTHY on the current market. If the dashboard shows a sharp winrate drop — the market has changed, be careful.
- Compare your real winrate with the indicator's statistics as a way to assess your discipline: the smaller the gap, the cleaner you execute the system.
9.9. Dashboard display settings
In the "📊 123 — Dashboard" group you can configure:
| Parameter | What it changes |
|---|---|
| Show Dashboard | Enables/disables dashboard entirely |
| Position | Display corner: Top Right (default), Top Left, Bottom Right, Bottom Left, Middle Right, Middle Left |
| Stats Period | Stats period: 24h, 7d, 30d, All |
| Table Font Size | Dashboard font size: Tiny / Small / Normal / Large |
The same group holds three more controls covered in their own sections: Show Risk Section in Dashboard (9.10), Show Presets Backtest Table with its own font size (9.12). Note also that the stats period is a non-destructive filter: switching 24h → 7d → All never deletes history — the dashboard simply re-filters the same trade log.
24h: for active day traders — see current "mood."
7d: for swing traders — weekly picture.
30d: for assessing overall systematicness — monthly overview.
All: for long-term analysis — everything the indicator has processed.
I recommend keeping 7d as main — best balance of "freshness" and statistical significance.
9.10. Risk Section — the risk panel next to the dashboard
Enable “Show Risk Section in Dashboard” (📊 123 — Dashboard group) and the dashboard grows to the side: a second panel appears to the right of the main one, dedicated entirely to money and discipline. Rows duplicated from the main dashboard (Position, Max Loss, etc.) are automatically hidden there to save space. The panel has four blocks:
RISK MANAGER
Your standing risk parameters: Balance, Risk per trade (amount and % of balance), Leverage and sizing mode. A sanity mirror — if what you see here surprises you, fix the Risk Manager settings before the next trade.
ACTIVE TRADE
The live state of the current trade: Position (size and notional), Margin (with a red ⚠ when it exceeds your balance), Entry → Price (deviation from entry), Live P&L in money and R, SL distance, and Risk locked — what you actually stand to lose if the CURRENT stop is hit. Once trailing moves the stop to breakeven, Risk locked flips to a green “$0 (risk-free)” — one glance tells you the trade can no longer hurt you.
EXIT SCENARIOS
Every possible exit translated into money before it happens: TP1, TP2, TP3 each shown as price → profit in currency and in R (with a ✓ once reached), If SL hit — the exact damage at the current stop level, and RR remaining — the risk:reward from the current price to TP3 against the current stop. RR remaining below 1:1 in amber is the panel's way of saying “chasing from here is a bad deal.”
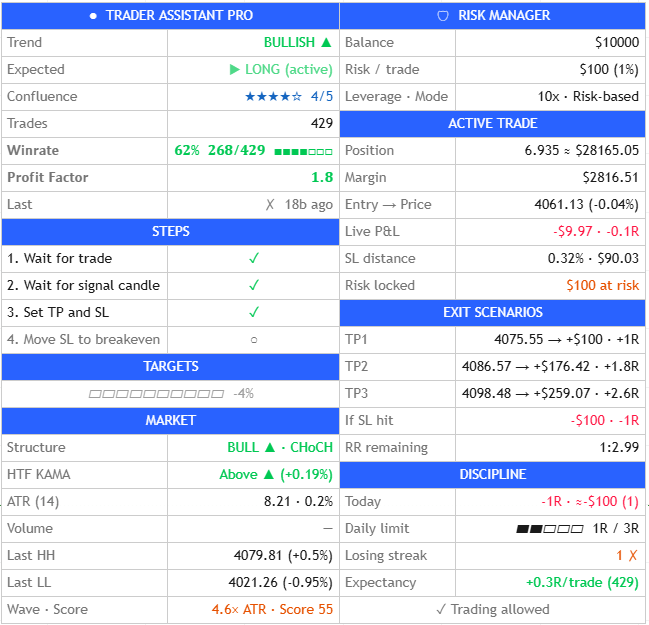
DISCIPLINE
The block that replaces willpower with arithmetic:
- Today — the running R and money result of today's closed trades.
- Daily limit — a progress bar of losses consumed against your Daily Loss Limit (R) setting (default 3R). Amber from two-thirds, red at the limit.
- Losing streak — consecutive losses; highlighted from your Losing Streak Warning threshold (default 3).
- Expectancy — average R per trade over the whole recorded history.
- Status line — “✓ Trading allowed” or the red banner “⛔ STOP TRADING — daily limit”.
The indicator cannot lock your exchange account. When the banner turns red, the only enforcement mechanism is you. The whole point of setting a daily limit in advance (chapter 7) is that the decision to stop was made by a calm version of you — the red banner just reminds the tilted version of the agreement. Honor it.
9.11. MARKET block — instrument context at a glance
When the Risk Section is on, the main dashboard gains a MARKET block that fills the widened layout with the current market context:
- Structure — SME swing trend (BULL/BEAR) with the latest break type (BOS or CHoCH).
- HTF KAMA — whether price is above or below the higher-timeframe trend line, and by how much.
- ATR (14) — absolute and as % of price; with Adaptive Thresholds enabled, also the volatility percentile (P0 = quietest regime in the window, P100 = noisiest — see 11.11).
- Volume — current bar volume vs its average.
- Last HH / Last LL — the anchors of the current impulse leg with distance from price.
- Wave · Score — the active formation's wave size in ATR and its Pattern Score.
9.12. Presets Backtest Table — the honest reference card
Enable “Show Presets Backtest Table” (📊 123 — Dashboard group) and a static table appears in the bottom-left corner: the yearly backtest result of every preset — trades per year, winrate, profit factor, net R and the number of losing months. The row of the currently active preset is highlighted. Font size is configurable separately.
This table is a reference card, not live statistics: the numbers are hard-coded results of the optimization run (Aug 1, 2025 — Jul 29, 2026, 15m). It will not change as you trade — that's what the dashboard's own Trades/Winrate/PF rows are for.
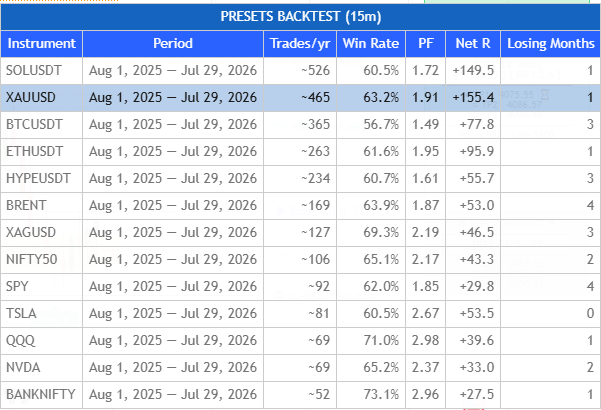
The table is in-sample (parameters were selected on the same data they were scored on), assumes zero fees and slippage, and counts breakeven exits as wins. Your dashboard counts YOUR window of data on YOUR timeframe, and your exchange charges real fees. If your live PF lands below the table — that is expected, not a defect. Use the table to compare instruments against each other, not as a promise.
Now about how not to step on the rakes that trip up most beginners.
Chapter 10. Common Beginner Mistakes and How to Avoid Them
I've watched traders for years — how they start, how they make mistakes, how they blow accounts. Surprisingly, the list of mistakes is finite. There are maximum 15-20 of them, and they repeat across everyone. In this chapter we'll cover the most common and most dangerous ones, so you can avoid them.
First time — now, to understand what to avoid. Second time — after 50 trades, when you'll have made at least two of these mistakes (and you will), and want to honestly look in the mirror. And the third time — in a moment of emotional breakdown, to stop yourself.
10.1. Mistake: Entering without pivot confirmation
What it looks like
OTE zone appeared. Price entered it. You think: "Well there it is, the pattern is ready, price is in the zone — I'm in." You enter at market without waiting for the pivot label.
Why it's dangerous
OTE zone touch is not yet confirmation that buyers/sellers came to defend the level. It's just the fact of price being in the area. Without the pivot label, you enter a lottery: price might reverse, or might rip right through the zone to the stop.
How to avoid
- Hard rule: NO pivot label — NO entry. Period.
- In the dashboard, look at the STEPS block. If only item 1 ("Wait for trade") has a checkmark and item 2 ("Wait for signal candle") has an empty circle — it's too early to enter.
- If you really want to enter early — ask yourself: "If price breaks through the zone right now and hits stop — will I be mad or accept it as part of the system?" If mad — definitely don't enter.
10.2. Mistake: Ignoring the trend filter
What it looks like
Trend Bands red (downtrend), HTF Trend line above price. But the indicator for some reason showed a long setup with Score 65 (e.g., because Trend Filter is off). You think: "65 is a good score, the pattern is high-quality" — and you trade.
Why it's dangerous
Counter-trend trades are possible in principle, but require strong skill in reading structure. For a beginner, they mostly end in losses, because the general market flow is against you. One loss against the trend = three wins with it.
How to avoid
- Enable Trend Filter = "Trend Bands" in settings and don't disable it for the first 200 trades at minimum.
- Before every trade, look at the dashboard: does the trade direction match the Trend field?
- If you're shorting but Trend shows BULLISH — skip, even if Score is high.
10.3. Mistake: Excessive risk per trade
What it looks like
Deposit $1000, you set Allocation = 5%. You think: "1% is too slow, $50 a week doesn't suit me, I'll set 5% and make $250."
Why it's dangerous
At 5% risk, a streak of 5 losses (happens to everyone) eats almost 25% of the deposit. Psychologically that's deadly — most beginners at this moment start "getting back," increase risk further, and blow the account for good. See the table in Chapter 7 — the math is right there.
How to avoid
- Allocation = 1.0% and no more. Ever. No exceptions.
- If deposit is too small and 1% is ridiculous numbers — that's not a reason to raise risk. It's a reason to trade demo until you save up a normal deposit.
- Want to earn more — raise the count of quality trades, not the size of each.
10.4. Mistake: Trading in a range without a trend
What it looks like
Trend Bands gray (NEUTRAL), price swings in a narrow range. But the indicator shows small 1-2-3 setups inside this range. You trade each one — and lose most.
Why it's dangerous
The 1-2-3 pattern is a trending formation. In a range, it produces many false signals, because price just bounces from boundary to boundary, and any pullback could turn out not to be a "pullback" but a full reversal.
How to avoid
- If Trend in the dashboard shows NEUTRAL — that's a signal to "better not trade."
- Wait until price breaks out of the range and a clear trend appears.
- Use Min Pattern Score 60+ — most "range-bound" formations have a low Score and will be filtered automatically.
10.5. Mistake: Moving the stop against yourself
What it looks like
Opened a long. Price moves against you, approaching the stop. You think: "It should reverse now, I'll move the stop lower, give the trade some room to breathe." Moved it. Price breaks the new stop. You move it again. And again. Instead of losing 1% — you lose 5% and your psyche is wrecked.
Why it's dangerous
Once you let yourself move the stop, you create a habit. Going forward this will happen in every losing trade. This is the most direct path to blowing the account — statistically the #1 cause of account closure.
How to avoid
- Hard rule: stop is set ONCE, when opening the trade. After that it can move ONLY in the safe direction (to breakeven or to +1R/+2R per the trailing rules).
- If you really want to move it — close the exchange app. Open it in 30 minutes, when either the stop fires or the situation clears up.
- Post on your wall or monitor: "If I move the stop against myself — I'm voluntarily handing my account to the market."
10.6. Mistake: Averaging a loss
What it looks like
Opened a long on 0.05 BTC at 60,000. Price dropped to 58,000. You think: "I'll buy another 0.05 — lower the average to 59,000, and on the bounce I'll get out faster." Price drops further. You average again. And again.
Why it's dangerous
Each averaging is increasing position in a losing trade. Real risk grows multiple times. And when (if) the stop fires, losses are catastrophic. And if you averaged without a stop — you're not far from liquidation.
How to avoid
- Hard rule: one formation = one trade. Position size is calculated by the indicator — you can't increase it after the fact.
- If you want to add — wait for a new formation in the dashboard. If the indicator doesn't show one — there's nothing to add to.
- Remember: pros average in profit (pyramiding), not in loss.
10.7. Mistake: "Tilt" after a loss streak
What it looks like
Three trades closed in a row as losses. You're irritated. A new setup appears. You don't check confluence, don't think about trend direction, just open — you need to "win it back." You open with bigger size to "recover faster." You lose even more. That's tilt.
Why it's dangerous
Tilt is an emotional state in which the prefrontal cortex (rational thinking) shuts off, and the limbic system (emotions) makes decisions. All the rules you set up in a calm state fly out the window in tilt. This is neurophysiology, not "weakness of character."
How to avoid
- Hard rule: 3 losses in a row — pause 24 hours. 5 in a row — pause a week.
- Close the terminal, leave the house, physical activity — best way to exit tilt.
- Set yourself a daily stop-loss: lost 3% of deposit in a day — exchange closes till tomorrow.
10.8. Mistake: FOMO — fear of missing the move
What it looks like
Price is flying up fast. You didn't enter on the setup. You think: "I can't go on like this, I'm missing so much profit!" — and you open a long at market without any setup, hoping to catch the rocket.
Why it's dangerous
A strong move usually ends with a sharp pullback or reversal. You enter at the very top and immediately fall into that pullback. There's no stop (no setup — where would you put it?), position goes red, panic sets in.
How to avoid
- Hard rule: NO setup — NO trade. Whatever is happening on the chart.
- Remember: a missed move = zero. Account blown in FOMO = minus everything. This is an asymmetric trade with mathematically negative expectation.
- The next setup will come. It always has. It will now.
10.9. Mistake: Trading on news
What it looks like
In 30 minutes there's a Fed meeting. A setup formed on the chart. You think: "The indicator shows it, so it's a good entry" — and you open. 30 minutes later, the decision comes out, price makes a 5% candle against you, stop hit, deposit minus.
Why it's dangerous
News is force majeure. On news, any technical pattern breaks in one candle. No risk management saves you if the market gaps through your stop.
How to avoid
- Get in the habit of checking the economic calendar in the morning: investing.com → Economic Calendar → note times of important news.
- 1 hour before and 1 hour after important news — don't trade. Open positions — better close, or at least make sure SL is in place.
- For crypto: watch "whale" moves (big transfers to exchanges), regulatory news, events in major projects (Ethereum upgrades, Bitcoin halving).
- For stocks: don't trade a company the day before and the day of its quarterly earnings.
10.10. Mistake: Closing profit too early
What it looks like
Opened a trade. Went +0.5R into profit. You think: "A bird in hand" — close everything. Price blows through all three TPs. You're left with +0.5R instead of +2R.
Why it's dangerous
If you systematically close trades earlier than plan, your average RR drops from the projected 1.5-2.0 to 0.5-0.8. At the same 50% winrate, this turns a profitable system into a losing one. Mathematical catastrophe in the long run.
How to avoid
- Discipline: TP orders are placed on the exchange immediately when opening the trade and ARE NOT CANCELED. Technically, closing by hand earlier is impossible without removing orders.
- Use partial close per the 50/30/20 system. Already at TP1 (0.5R from Entry in recalc) you lock half — psychologically you feel calmer, and the rest can quietly run to bigger targets.
- In the journal, keep a "closed by plan / closed early" column. After 50 trades you'll see your stats — very sobering.
10.11. Mistake: Too many trades at once
What it looks like
Morning. On different instruments, 5 setups appeared simultaneously. You opened all of them — "diversification." By the end of the day you have 5 open positions and you're panicking, juggling between them.
Why it's dangerous
Attention is limited. 5 simultaneous trades = you don't have time to react properly to any of them. Besides, if the market starts a correlated move (e.g., panic on crypto), all 5 trades go red at once, and your risk is not 1% but 5%.
How to avoid
- Max 3-4 simultaneously open trades.
- Total risk of all open positions — no more than 4% of deposit.
- On correlated instruments (BTC + ETH, EUR/USD + GBP/USD) — max 2 trades in one direction.
- If 5 setups appear — pick 2-3 with the highest Score and confluence, skip the rest.
10.12. Mistake: Not keeping a journal
What it looks like
You trade, periodically check the dashboard: "winrate 53%, profit factor up — fine." But you don't remember what happened in each trade, what mistakes you made, what conditions you won more often in.
Why it's dangerous
The dashboard shows what happened, but doesn't answer why. Without a journal you can't:
- Understand which types of setups work better on you and which worse
- Catch your emotional patterns (e.g., that after 2 losses you more often break rules)
- Objectively assess the effect of settings changes
- Grow as a trader — growth is impossible without feedback
How to avoid
Keep a minimal journal — even a simple Excel/Google Sheets/Notion table will do. Minimal column set:
| Column | What to record |
|---|---|
| Date/time | When the trade was opened |
| Instrument | BTCUSDT, EURUSD, etc. |
| Direction | Long / Short |
| Stage | 2 or 3 |
| Score | Pattern Score from indicator |
| Confluence | How many confirmations (X/5) |
| Entry/SL/TP3 | Prices |
| Result (R) | +1.5R, -1R, etc. |
| Emotion | Calm / nervous / FOMO / tilt |
| Note | Any comments — what you noticed, what was unusual |
One of the main secrets of professional traders: they keep journals for years and re-read them regularly. It lets them see their evolution, catch repeating mistakes, and reinforce successful behavior patterns. Without a journal, by the 10th trade you forget what happened on the 1st.
10.13. Summary table: spot and prevent
| Symptom | What it is | What to do |
|---|---|---|
| "I'll enter now, figure it out later" | FOMO / no setup | Close the terminal for 15 minutes |
| "I'll move the stop, market will reverse" | Moving stop | Hard: NO. Stop is one-time. |
| "I'll buy more, lower the average" | Averaging loss | Hard: NO. One trade = one position. |
| "Need to win back 3 losses" | Tilt | Pause 24 hours, physical activity |
| "This setup will definitely work, I'll size up" | Inflated risk | Never raise Allocation % |
| "Setup against trend, but it's high-quality" | Counter-trend | Skip, wait for a with-trend setup |
| "5 trades open, I'm hanging in there" | Overload | No more than 3-4 simultaneously |
In the next chapter we'll cover the advanced indicator features we've set aside so far.
Chapter 11. Advanced Features of the Indicator
This chapter is for those who've already mastered basic 1-2-3 trading and are ready to add extra layers of analysis. Here we'll cover features that are off by default — because for a beginner they tend to overload the picture more than help. But in skilled hands they give a serious edge — filtering out weak setups and confirming strong ones.
After reading this chapter you'll want to activate every advanced feature right away. Don't. Turn them on one at a time, trade 30-50 setups, evaluate the effect. If a feature actually improves your stats — keep it. If it just adds visual noise — turn it off. This is what conscious use of a tool looks like.
11.1. Fair Value Gaps (FVG) — what they are and why
A Fair Value Gap (FVG) is a concept from Smart Money Concept (SMC). It's an area on the chart where price moved too fast, leaving a "hole" in liquidity — a price range that wasn't tested by buyers and sellers in the usual back-and-forth way.
How an FVG is defined
An FVG forms on three neighboring candles:
- Bullish FVG: low of the third candle > high of the first candle. The space between them forms a "bullish gap."
- Bearish FVG: high of the third candle < low of the first candle. The space between them is a "bearish gap."
On the chart, an FVG shows as a semi-transparent green or red rectangle covering this "hole."
Why FVGs work
The logic: the market tends to "fill" inefficient price zones. With high statistical probability, price comes back to an FVG in the future to test that level. So FVGs often act as support/resistance — a bounce off an FVG in the direction of the original move is quite likely.
How to enable and configure
Open the "📊 SME — Fair Value Gaps" group:
- Show Bullish FVG / Show Bearish FVG — checkboxes to enable
- Bullish/Bearish FVG Color — colors (I recommend the defaults)
- FVG Mitigation Type — the most important parameter (see below)
FVG Mitigation Type — when to "close out" an FVG
"Mitigation" is the process where price comes back to an FVG and tests it. The indicator has several modes for what counts as "tested":
| Mode | What counts as mitigation | When to use |
|---|---|---|
| None | FVG is never removed | If you want to see the full history |
| Wick Touched | Touch by a candle wick | Strictest — FVG removed on first touch |
| Wick Half Filled | Wick covered half the FVG | Moderate |
| Wick Filled | Wick went fully through the FVG | Standard |
| Body Half Filled | Candle body covered half the FVG | More lenient |
| Body Filled (default) | Candle body went fully through the FVG | The most commonly used |
| CE Touched | Touch of Consequent Encroachment (FVG midline) | Advanced SMC |
Noise filters: Min FVG Size and Max FVG Age
Two filters keep the gap map (and the “FVG nearby” confluence star) meaningful:
- Min FVG Size (× ATR) — gaps smaller than this fraction of ATR(14) are ignored entirely: not drawn, not counted for confluence. Micro-gaps are noise, not institutional footprints. 0 = off; presets that use the FVG star set 0.15.
- Max FVG Age (bars) — a gap older than N bars is removed even if never filled. A 3-week-old imbalance says little about today's order flow. 0 = unlimited; the same presets use 200.
Note two related behaviors: when the Confluence Gate is enabled, FVG detection runs even if the display toggles are off (the gate needs the data); and a gap whose middle candle gets immediately closed through by an opposite-color candle is tagged with a small “V” — a hint that the imbalance met instant opposition.
How to use FVGs in trading
- An FVG aligned with your trade direction is extra confluence. If a bullish FVG sits close to your long entry — the setup gets stronger.
- An FVG against your direction is a potential obstacle. If you're going long to TP3 and a bearish FVG sits in the way — a bounce off it is likely.
- Entry "by FVG" is an advanced technique: you enter when price returns to an FVG in a strong trend. In Trader Assistant Pro this can be automated via the FVG Pullback Signals parameter.
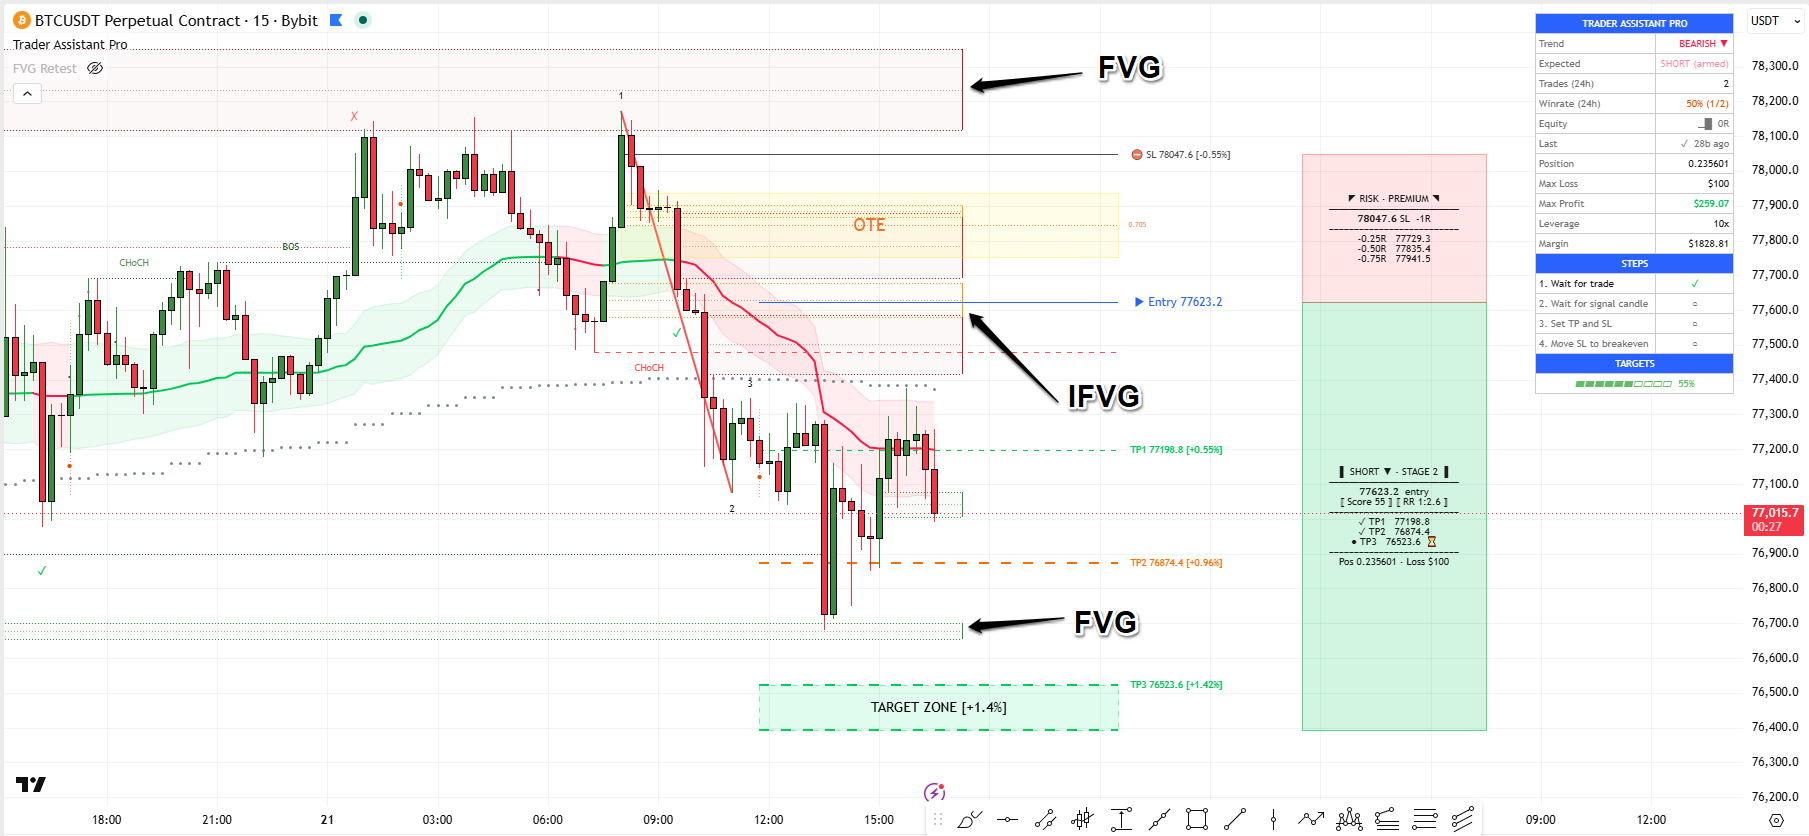
11.2. Inverse FVG (iFVG) — flipped gaps
An Inverse FVG is a "broken-through" FVG. When a regular FVG was tested and price passed through it, it flips to its opposite: bullish → bearish, bearish → bullish. And now it acts as resistance instead of support (or the other way around).
The logic
If a bullish FVG was broken (price closed below its lower edge) — it means buyers "failed to hold" the level. Now this isn't a support anymore — it's a zone with stranded buyers who'd like to exit at breakeven. When price comes back to this zone, they'll sell → resistance forms.
How to enable
In the same FVG settings group, enable:
- Show Inverse Bullish FVG / Show Inverse Bearish FVG
- Colors can stay default (usually darker shades)
iFVGs are actively used by experienced SMC traders. For a beginner this concept can feel confusing — I recommend mastering regular FVGs first, then layering on the inverse ones. Otherwise the chart turns into a mush of colored rectangles.
11.3. FVG Pullback Signals — automatic FVG-based signals
The indicator has a separate function: automatically drawing signals when price returns to an FVG in conditions of a strong trend. This is an alternate way to enter trades, not tied to the 1-2-3 formation.
How it works
- Market is in an uptrend (Trend Bands green).
- Price pulls back down and touches a bullish FVG.
- The indicator draws a buy signal (label or arrow).
This is a simplified "trade from FVG in a trend" strategy. Less precise than 1-2-3, but gives more signals. Can be used as an extra filter or as a standalone strategy (though I wouldn't recommend using it instead of 1-2-3 — better as a supplement).
11.4. Internal structure (HH/HL/LH/LL)
In the "📐 SME — Structure" group there's an Internal Structure parameter. If you enable it, the chart will show internal extreme markers using a short length (5 bars by default, versus the standard 10 for swing structure).
What HH, HL, LH, LL mean
| Marker | Full name | What it means | Signal |
|---|---|---|---|
| HH | Higher High | A higher high | Uptrend continuation |
| HL | Higher Low | A higher low | Uptrend confirmation |
| LH | Lower High | A lower high | Downtrend continuation |
| LL | Lower Low | A lower low | Downtrend confirmation |
When internal structure is useful
- For gauging trend strength: if you see HH+HL — the trend is healthy, longs have priority.
- For early detection of a reversal: if in an uptrend an LH suddenly appears instead of an HH — that's the first sign of weakness.
- As an entry filter: only go long when the structure shows confirmed HH+HL.
On lower timeframes (5-15 min), internal structure produces a LOT of marks — the chart turns into a disco. On those timeframes it's better to disable it and work only with swing structure (the standard).
11.5. Swing Structure (BOS / CHoCH)
At the swing-structure level (default length 10), the indicator draws not just HH/LL but more meaningful signals:
BOS — Break of Structure
A break of the previous meaningful extreme in the direction of the trend. Confirms trend continuation:
- Bullish BOS: previous HH is broken — uptrend continues.
- Bearish BOS: previous LL is broken — downtrend continues.
CHoCH — Change of Character
"Character shift" — a break of the previous meaningful extreme AGAINST the trend. This is the first sign of a reversal:
- Bullish CHoCH: in a downtrend, the previous LH is broken — possible reversal to long.
- Bearish CHoCH: in an uptrend, the previous HL is broken — possible reversal to short.
How to use BOS and CHoCH
- BOS confirms the trade direction. If you're long and there was a recent bullish BOS — that's a plus for confidence.
- CHoCH is a caution signal. If you have a long open and a bearish CHoCH appears — seriously consider exiting.
- If you set Trend Filter = "Swing Structure" in the settings, the indicator will trade strictly by BOS/CHoCH, which gives an even stricter direction filter.
Using Trend Filter = "Swing Structure" instead of "Trend Bands" is a switch to a pure SMC trading style. You'll get fewer setups, but they'll be higher quality on average. Try it on 50-100 trades after mastering the basics and compare the stats.
11.6. Range Volume Profile (LL↔HH)
The indicator can build a volume profile over the current impulse leg — the price range between the last confirmed LL and HH of the swing structure. It answers one question: within the move you are about to trade a retracement of, WHERE did the actual business happen?
How to enable and read it
Turn on Show Range Volume Profile in the 📐 SME — Auto Fibonacci & Range VP group. The impulse range is split into 24 equal price bands, and the profile is drawn to the right of the chart's edge as horizontal rows, order-flow style:
- Blue rows — regular volume at that price band; width is proportional to volume.
- Yellow row + dashed line — the POC (Point of Control), the single price band with the most volume, its line extended left toward the chart.
- Orange rows — stop zones. Bands whose volume exceeds the profile average × the Stop Zone Volume Multiplier (default 1.5). Each is labeled with its multiple (e.g., “2.3x”) and a B or S — which side dominated, estimated from where candles closed within their range.
On forex feeds without exchange volume the profile falls back to tick volume; with no volume at all, each bar counts as one, degrading gracefully to time-at-price. The profile hides itself while a trade projection is active (the trade visuals take priority) and returns after the trade closes.
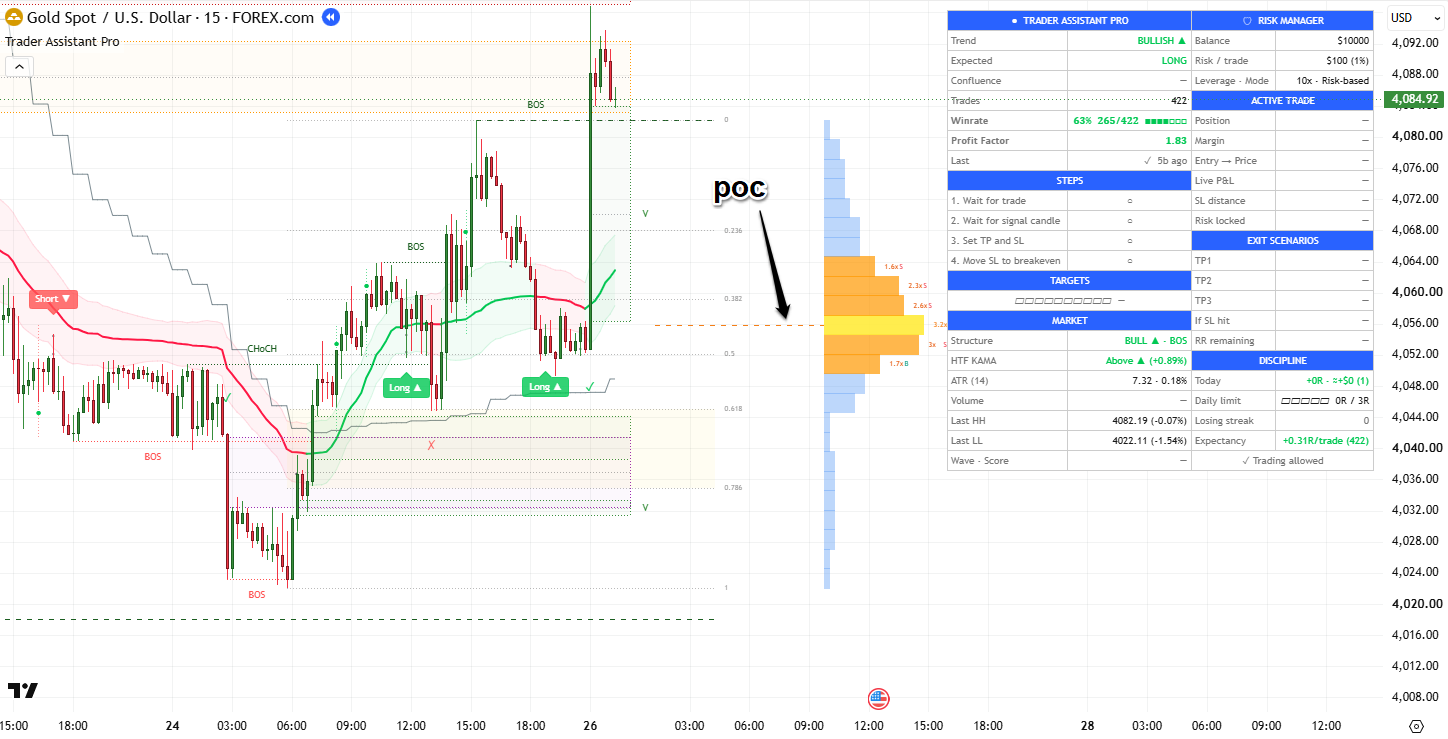
How to use
- POC near the OTE zone — extra confluence for the entry: the market's busiest price agrees with your retracement level.
- A stop zone between Entry and TP3 — a probable stall or bounce point; a candidate level for a partial close.
- A stop zone labeled S sitting above your long entry — expect sellers to defend it; don't be surprised by a fight at that level.
The profile gives real information but visually loads the chart. Enable it when you actively read it; keep it off otherwise. And remember the B/S tags are a proxy computed from candle closes, not real order-flow data — treat them as a hint, not a fact.
11.7. Customizing Pattern Score
If you understand how Score works (see Chapter 4), you can adjust its weights to your style. The indicator has three parameters governing the calculation:
- Score Weight: Retracement Quality — weight of the pullback quality (the main weight by default)
- Score Weight: Leg Size — weight of the impulse leg size
- Score Weight: Symmetry — weight of symmetry
By default the weights are balanced and in most cases you shouldn't touch them. It only makes sense to change them if you've traded long enough to see that one factor correlates more strongly with your results than the others.
11.8. Customizing colors and theme
In the "🎨 SME — Visual & Colors" group you can re-configure almost all indicator colors. This is especially useful if:
- You use a non-standard TradingView theme (e.g., a dark-blue background).
- You're colorblind and can't distinguish green/red — you can switch them to blue/orange.
- You want to turn off some elements (e.g., the dots on pullback levels).
11.9. Auto Fibonacci LL↔HH — the market map behind the pattern
Independent of the 123 module's yellow OTE box, the indicator can stretch a full Fibonacci retracement across the current impulse leg — from the last confirmed LL to the last confirmed HH of the swing structure. In a bull swing trend the grid measures the retracement of the LL→HH move (0 at the high); in a bear trend, of the HH→LL move (0 at the low). Levels drawn: 0, 0.236, 0.382, 0.5, 0.618, 0.786, 1.
- Highlight OTE Zone (0.618–0.786) — shades the impulse leg's own OTE band. When the 123 formation's yellow box lands inside this band, two independent methods agree on the entry area — strong confluence.
- Extension levels — optional projections beyond the impulse extreme (-0.181, -0.272, -0.5, -0.618), each with its own toggle. Natural targets for the continuation you are trading toward; useful for placing runners beyond TP3.
Like the Range Volume Profile, the auto fib hides itself while a trade projection is active and reappears after the trade closes — during a trade, your levels are Entry/SL/TP, not the map.
11.10. Pullback PRO — the strict reversal engine
The standard trade confirmation (chapter 5, step 4) accepts any reversal candle at a swing extreme inside the SL↔Entry zone. Pullback PRO is an optional, stricter reversal detector layered on top. A PB PRO signal requires ALL of:
- a reversal at a swing extreme (via pivots, or a rolling high/low window — configurable);
- a candle body of meaningful size relative to the average body (Body Multiplier);
- a rejection wick against the move (Wick Multiplier);
- volume above average × threshold (optional Volume Filter; on feeds without volume data the filter passes automatically instead of blocking everything);
- optionally, agreement with the KAMA color: bullish signals only while Trend Bands are green, bearish only on red, and the neutral gray blocks both (Filter by KAMA color).
Two independent ways to use it:
- As a visual layer. Show Pullback PRO draws arrows (and/or colors bars) at qualifying reversals across the whole chart — a second opinion on every bounce.
- As extra trade confirmation. “Use PB PRO as extra confirmation” makes the Long/Short trade confirmation itself require the reversal candle to pass the PB PRO filters. Noticeably fewer entries, each backed by a real rejection with participation. This works even when the visual layer is off.
If your journal shows entries on weak, low-volume reversal candles that immediately get run over — PB PRO confirmation is aimed exactly at that leak. The cost is missed trades where the reversal was quiet but real. Test it on your instrument before adopting: on thin markets the volume filter can be too aggressive.
11.11. Adaptive Thresholds — the volatility regime sensor
Fixed thresholds have a weakness: a wave filter tuned for a quiet market lets everything through in a storm, and vice versa. Adaptive Thresholds (🧠 group) replace three fixed values with ranges that breathe with the market. The mechanism: the indicator ranks the current ATR% against the last N bars (Volatility Lookback, default 200) and gets a percentile from 0 (quietest regime in the window) to 1 (noisiest). That rank scales:
- Stage 2 Min Wave — stricter in noisy regimes (scales from Min toward Max). Noise produces more fake early formations; the bar rises to meet it.
- FVG Confluence Zone — the search radius for the “FVG nearby” star, in ATR multiples. In a noisy regime ATR itself is inflated, so the multiplier shrinks toward Min to keep the physical search distance sane.
- Min FVG Size — stricter in noisy regimes: a gap must be bigger to matter when everything is a gap.
Each of the three adaptations has its own toggle and Min/Max range. With Adaptive Thresholds on, the MARKET block shows the current regime as “P” percentile next to ATR (9.11).
The instrument presets were optimized with FIXED thresholds. Turning on adaptation under a preset changes the trade composition away from what was backtested. Treat Adaptive Thresholds as an experiment for Custom mode and instruments with strongly alternating quiet/violent phases — and validate before trusting.
11.12. Live re-anchoring — why levels can move before entry
You will occasionally see this: a trade plan appears, and over the next candles the Entry, SL and TP lines slide as price pushes to new extremes. This is not repainting — it is documented behavior called re-anchoring, and understanding it will save you confusion:
- While a trade is armed (plan drawn, price hasn't touched Entry yet): if price prints a new extreme beyond point 2, point 2 moves to that extreme and the entire Fibonacci plan — Entry, SL, all TPs, the OTE box — is recomputed from the true top (or bottom) of the wave. The 1-2-3 annotation is removed because it no longer describes the current wave.
- The anchor locks the moment price touches Entry. From that candle on, the levels are frozen — what you trade is what you see.
- Pending formations re-anchor too. If no trade opened on the detection bar, the OTE zone, 0.705 line and SL keep following new extremes until price finally starts to correct — so the zone you eventually trade is measured from the real extreme, not a stale one.
- Growth has a limit. If the wave outgrows Max Wave Size (× ATR) during re-anchoring, the setup is invalidated and torn down entirely — a runaway squeeze is not a tradable pullback pattern.
Practical consequences: Step 1 (trade_armed) alerts carry levels that may still shift — never pre-place orders from them (chapter 8); and confirmed trades always show the final, locked levels, which is why the Trade Confirmed alert is the one to execute on.
11.13. Small switches worth knowing about
- Keep Entry Labels on History (🎨 123 — Visual) — when on (default), the Long/Short entry labels stay on the chart after a trade closes, next to the ✓/✗ result marks. You get a visual journal of every confirmed entry. Off — the label lives only while the trade is active.
- Show Swing Reversal Triangles / Color Reversal Bars (🏷️ Swing Reversal group) — the raw output of the reversal engine that confirms trades, drawn across the whole chart regardless of trade zones. Useful for a day or two to learn what the confirmation candle looks like; too noisy to keep on permanently. The Swing Period input here (default 5) is the engine all presets were optimized with — don't change it under a preset.
- Show FVG Pullback Signals (📊 SME — FVG) — dots marking pullback touches of an active gap's borders and midline; a micro-entry aid for FVG traders.
- Force-close stale trade after N bars — covered in 6.1; mentioned here because it is easy to miss and quietly improves the honesty of your statistics.
11.14. When and which features to enable — practical advice
| Experience | What to enable | What to leave off |
|---|---|---|
| Beginner (0-50 trades) | Just the base from Chapter 2 | All advanced features |
| Starting (50-200) | + HTF Trend heavily, BOS/CHoCH for observation | FVG, iFVG, Volume Profile |
| Experienced (200-500) | + FVG (Body Filled), internal structure | iFVG, Volume Profile (optional) |
| Advanced (500+) | Anything that actually improves your stats | Only what doesn't help according to the journal |
Don't add features "because they're there." Add them only when you can explain HOW exactly this feature improves your trading.
After adding — definitely track the effect for at least 30 trades. If winrate or average R improved — keep it. If not — turn it off without regret.
A good trader uses FEWER tools than a bad one. Fewer — but more deliberately.
Final chapter — FAQ and a checklist worth printing out.
Chapter 12. FAQ and Final Checklist
Final chapter. Here are answers to the questions users ask most often, plus a printable checklist I recommend keeping in sight during your first weeks of trading.
12.1. Frequently Asked Questions
Q: Why didn't the trade open even though price went through Entry?
A: Most likely, the pivot label didn't appear. The indicator doesn't count a trade as open just because price reached the level — a reversal signal inside the zone is required. This is intentional, to filter out "sweeps" through the zone without an actual market reaction.
Check: is there a green "Long" or red "Short" label visible on the chart near the entry candle? If not — the setup wasn't confirmed, and you shouldn't have opened it.
Q: What do I do if the pivot label appeared but price has already moved far from Entry?
A: This is called "signal slippage" — the pivot forms at the bar close, and by the time you see the alert, price can be 0.3-0.5% further out.
If price moved a small distance (within 0.3-0.5% of Entry) — you can enter Market, the risk roughly matches the calculated one. If it moved further (1%+) — skip this trade and open on the next setup. Don't chase price.
Q: Can I use the indicator on a 1-minute chart?
A: Technically — yes, the indicator works on any TF. Practically — I strongly discourage it for beginners. On a 1-minute chart:
- There's too much noise, formations often turn out to be "fakes"
- You need to make decisions in seconds — no time to check context
- Fees and spread eat most of the profit
- Emotional load is extreme
The minimum recommended TF for a beginner is 15 minutes. The optimal is 1 hour.
Q: What do I do when major news comes out?
A: One hour before and one hour after major news — don't open new trades. For already-open positions:
- If you're in profit and price has gone enough toward TP1 — you can close part of the position or the whole thing early
- If at breakeven (after TP1) — leave it alone, there's no risk anymore
- If in loss and far from the stop — leave it, hope it doesn't get hit
- If close to the stop — you can close manually to avoid a price "gap" through the stop with slippage
Q: Does the indicator repaint?
A: Yes and no. The structural elements (points 1-2-3, OTE zone) can refine as new bars appear — this is normal for any indicator based on pivot logic. However, the entry signals (pivot labels) and the trade plan (Entry/SL/TP) are locked in for good when the signal candle closes and don't change anymore.
So: while the setup is still forming, it can refine. Once the pivot label appears and the plan is locked, there's no re-drawing.
Q: Can I use it on several instruments at the same time?
A: Yes, and it's even useful for diversification. But follow the portfolio risk rules (see Chapter 7):
- No more than 3-4 simultaneous trades
- Total risk of all open positions — no more than 4% of deposit
- On correlated instruments (BTC+ETH, EUR/USD+GBP/USD) — no more than 2 trades in one direction
Technically you just open several TradingView tabs with different instruments and the indicator configured the same way.
Q: Can I trade without HTF Trend?
A: You can, but I don't recommend it for beginners. HTF Trend is a "top-down view" of the market that prevents you from taking trades with fundamentally wrong context. Without HTF Trend, you'll sometimes enter against a strong general move and wonder why your trades hit the stop so often.
Q: Which is more important — Score or Confluence?
A: These are different setup quality characteristics, and they complement each other:
- Score is the quality of the formation itself (geometry, sizes, symmetry).
- Confluence is the alignment of several independent factors (trend, HTF, FVG).
A setup with high Score but low Confluence (e.g., 70/1) is a "pretty formation in the wrong place." A setup with low Score and high Confluence (50/5) is "an average formation, but at the right time in the right place." In practice, the second tends to perform better. But the ideal, of course, is Score 70+ AND Confluence 4+.
Q: What do I do if my deposit is too small and 1% is ridiculous money?
A: This is a normal and common situation. A few options:
- Trade on a demo account — you can set any virtual deposit there. Goal: build experience so that when you switch to a real deposit, you trade right from day one.
- Save up and top up the account monthly. A real deposit for normal trading is from $1000 up. Less than that is a "learning playground."
- Never raise Allocation % "to make it more fun." The psychological habit of 5% risk will carry over to a big deposit — and then the blow-up will come very fast.
Q: Can I use the indicator on a demo account for practice?
A: Not just "can" — I strongly recommend it. The first 30-50 trades are best done on demo, to:
- Get used to the indicator's interface
- Learn to spot setups and filter out weak ones
- Drill the entry algorithm without the emotional weight of real money loss
- Test your settings on "your" instruments
Q: How often does the indicator update, and do I need to update anything myself?
A: In TradingView the indicator updates automatically on the server side — you don't have to do anything. If the author releases an update, you'll get it immediately on the next launch. Your personal settings are preserved.
Q: What do I do if my results are consistently negative across 50+ trades?
A: This is a serious signal. Possible causes and fixes:
- Check whether you're breaking the rules: entries without a pivot, moving the stop, counter-trend trades. Most often the problem is here.
- Check Allocation: maybe too high a risk gives a disproportionate loss on the losers.
- Check the market: maybe you're trading an instrument that's been in a range for weeks — the system just isn't for that.
- Check the TF: maybe 5-minute isn't working for you and you need to step up.
- Pause for 1-2 weeks, re-read this guide (especially chapters 5 and 10), and review all your trades in the journal.
Q: The dashboard shows Trades = 0, but I made 10 trades today. Why?
A: This is the most common misconception, so it gets its own question. The dashboard doesn't count your trades on the exchange — it counts the indicator's own virtual trades (see Chapter 9.8 in detail). If, during the chosen stats period (e.g., 24h), the indicator didn't register a single fully completed formation with a pivot entry — the statistics will be zero. This is not a bug.
What to do: either switch Stats Period to something longer (7d, 30d, All), or do nothing — the indicator will accumulate data over time. To track YOUR trades, keep a separate journal.
Q: What does "✓ 0b ago" or "✗ 5b ago" in the Last field mean?
A: "b" stands for bar. "0b ago" means the last trade closed just now (on the current bar). "5b ago" is five bars ago. If the TF is hourly, "5b ago" is 5 hours ago. If 15-minute — 75 minutes ago. It's just a way to show how "fresh" the last result is.
Q: Can I test the indicator on historical data (Replay)?
A: Yes, TradingView has a Bar Replay feature (the clock-with-rewind icon in the top panel). This is an ideal way to practice:
- Pick a date in the past, the indicator will draw history up to that date
- Hit Play — bars appear one by one, as in real trading
- You train at spotting setups and see how they played out
Important caveat: Replay won't show you the psychology of real trading. On historical data it's always easier — you know what came next. So Replay is useful for practicing pattern recognition, but it doesn't replace real (or at least demo) trading.
Q: How does the indicator behave during opening gaps?
A: A gap is a break in price between one candle's close and the next one's open (typical for stocks after weekends or major news). The indicator works with the prices that are on the chart, so:
- If the gap goes against your open position — the stop can fire with worse slippage than calculated. This is an objective market feature, not an indicator defect.
- If the gap goes with your direction — you can actually get more than the projected profit.
- If the gap breaks the formation — the indicator simply recalculates the structure on the new data and draws new levels.
Protection: for markets with gaps (stocks, forex at week start), either close positions before market close, or don't trade such instruments if you're not ready for gap risk.
Q: The indicator shows "Invite-only" even though I already paid. What do I do?
A: This is a technical access issue. Checklist:
- Make sure you're logged into TradingView under the same account that the access is tied to.
- After payment, access isn't granted instantly — usually within a few hours. Wait a bit.
- If a day has passed — write to the indicator's author (contacts should be listed in the indicator description on TradingView or in the materials you got after purchase).
- Close all TradingView tabs and log in again — sometimes refreshing the session helps.
Q: Can I use the indicator on several devices at the same time?
A: Yes, access is tied to the TradingView account, not the device. Open it on desktop, phone, tablet — everywhere it'll work with your settings.
Q: What language is the indicator in? Can it be changed?
A: All built-in text (labels, dashboard, alerts) is in English. This is intentional — English is universal, and a translation isn't really needed (trading terminology is English-language anyway: Long, Short, Entry, SL, TP, Pivot, etc.). All these terms are covered in this guide.
Q: The Entry/SL/TP levels moved after the setup appeared — is that repainting?
A: No. Before price touches Entry, the plan deliberately re-anchors point 2 to every new extreme so the Fibonacci grid measures the real wave, not a stale one (see 11.12 for the full mechanics). The moment price touches Entry, the anchor locks and nothing moves again. Confirmed trades — the ones with a pivot label and a Trade Confirmed alert — always show final levels. This is also why you should never pre-place orders from a Step 1 (armed) alert.
Q: I picked a preset and now some settings do nothing. Why?
A: That's the preset working as designed. An active preset overrides the optimized parameters (swing lengths, ATR period, wave filters, trend filter, Confluence Gate, FVG filters — full list in 6.8); your manual values for those inputs are ignored until you switch the preset back to Custom. Settings outside the optimization grid — Risk Manager, trailing, alerts, visuals — always remain yours.
Q: A clean pattern formed, but no trade opened. Why?
A: Beyond the reasons that existed before (trend filter against the direction, wave outside the Min/Max Wave limits, Score below minimum, price breaking the pattern before entry), there is now one more: the Confluence Gate. If the gate is enabled — manually or by a preset — a setup that collects fewer confluence stars than the threshold is silently discarded. Check the Confluence row in the dashboard: if it reads 2/5 and your gate is 3, that's your answer.
Q: The Presets Backtest Table shows great numbers, but my dashboard is worse. Is something broken?
A: Nothing is broken — the two measure different things. The table is a frozen reference: one specific year (Aug 2025 — Jul 2026), 15m timeframe, zero fees, breakeven counted as a win, and in-sample parameters. Your dashboard measures your window, on your timeframe, with the market you actually got. Live results below the table are the expected outcome, not an anomaly (see 9.12). Compare presets to each other with the table; judge your live trading with the dashboard and your journal.
12.2. Pre-trade checklist
Seriously, during your first weeks of trading keep a printed checklist somewhere visible. It works.
✅ Before opening a trade
- Has an OTE zone appeared with Entry/SL/TP levels highlighted?
- Is Pattern Score ≥ 60?
- Does Trend in the dashboard match the trade direction (green = long, red = short)?
- Is price on the correct side of the HTF Trend line?
- Is Confluence ≥ 3/5?
- Has price entered the OTE zone?
- Has a "Long" or "Short" pivot label appeared?
- No major news in the next hour?
- No more than 3-4 trades already open?
- No streak of 3+ losses today?
- Is Max Loss in the dashboard not highlighted in red?
- Is Position in the dashboard reasonable?
There are plenty of setups in a week. One skipped = zero losses. One taken "through a no" = potentially a serious loss. The math is on your side when you're disciplined.
✅ When opening the order on the exchange
- Direction: Buy for long, Sell for short
- Position size = exactly the Position field in the dashboard (you can round down)
- Order type: Market (if price is close to Entry) or Limit at the Entry price
- Stop Loss set at the price from the indicator (the SL line)
- Take Profit split by strategy (50/30/20 for conservative)
- Leverage on the exchange matches what the indicator shows
✅ Managing the trade
- When TP1 is reached — close part of the position per the strategy
- When TP1 is reached — make sure to move SL to breakeven (Entry)
- When TP2 is reached — close another part of the position
- When TP3 is reached — close the remaining position
- If the stop fires — calmly, no emotions. It's part of the system.
✅ After the trade
- Log the result in your journal (date, instrument, direction, Score, confluence, R result, emotion)
- Don't open the next trade immediately — pause for at least 1-2 candles
- If you've had 3+ losses in a row — pause for at least 24 hours
12.3. Printable memo (one page)
This section is laid out compactly on purpose — print it out and keep it next to your monitor during your first weeks of trading.
TRADER'S CHECKLIST — TRADER ASSISTANT PRO
BEFORE ENTRY — check every item:
☐ OTE zone has appeared with Entry / SL / TP levels
☐ Pattern Score ≥ 60
☐ Trend in the dashboard matches the trade direction
☐ Price is on the correct side of HTF Trend
☐ Confluence ≥ 3 / 5
☐ Long or Short pivot label has appeared
☐ No major news in the next hour
☐ No more than 3-4 trades open at once
☐ No streak of 3+ losses today
☐ Max Loss is not highlighted in red
WHEN OPENING THE ORDER:
☐ Position size = the Position field in the dashboard (you can round down)
☐ Stop Loss set at the price from the SL line
☐ TP split by strategy (50/30/20 for conservative)
☐ Leverage on the exchange matches indicator settings
MANAGING THE TRADE:
☐ TP1 → close part + move SL to breakeven
☐ TP2 → close another part
☐ TP3 → close the remainder
☐ SL fired → accept the loss without emotions, move on
HARD RULES (break them → account burns):
✗ Do NOT enter without a pivot label
✗ Do NOT move the stop against yourself (only to breakeven or + via trailing)
✗ Do NOT average down in a losing position
✗ Do NOT raise Allocation above 1%
✗ Do NOT trade against the trend
✗ Do NOT trade after 3 losses in a row — pause for 24 hours
✗ Do NOT chase a move without a setup (FOMO)
After every trade: log it in your journal (Score, confluence, R, emotion).
12.4. Final thoughts
You made it to the end. That's already more than most people who buy indicators do — many flip through the first few pages and go off trading by "trial and error." The fact that you read this guide says you're taking this seriously.
But reading is just the beginning. Real learning starts when you apply the knowledge in practice. There will be mistakes. There will be losing streaks. There will be moments when you want to quit or start "trading your own way." That's normal and inevitable.
Systematic trading isn't about money first. It's about discipline. About doing the same thing right a thousand times in a row, despite emotions and circumstances.
Trader Assistant Pro gives you the system. The discipline you'll have to build yourself. And when you build it, you won't just start earning steadily from trading — you'll become a different person. That's probably the most valuable side effect of taking trading seriously.
Good luck with your trading. Remember: discipline beats intelligence, statistics beat predictions, and there's nothing scary about one losing trade — it's part of your long, successful career.
— End of guide —